- 分析
- 技術分析
小麥 技術分析 - 小麥 交易: 2018-12-17
Demand for US wheat has increased
The U.S. Department of Agriculture (USDA) noted an increase in demand for US wheat. Will wheat prices rise?
In its weekly report, the USDA wrote that US wheat exports amounted to 754 thousand tons, which has been the maximum weekly volume since August of the current year. In addition, Iraq signed an agreement on the import of wheat from the United States in 2019. The total volume can reach 2 million tons. Egypt purchased 350 thousand tons of wheat this week. The price per ton was $4-6 higher than a week earlier. The Buenos Aires Grains Exchange has reduced the wheat crop forecast in Argentina in the 2018/19 agricultural season to 19 million tons from the 19.2 million tons. Now, 57% of crops have been harvested in Argentina. There is a risk of deterioration of the wheat harvest because of frost.
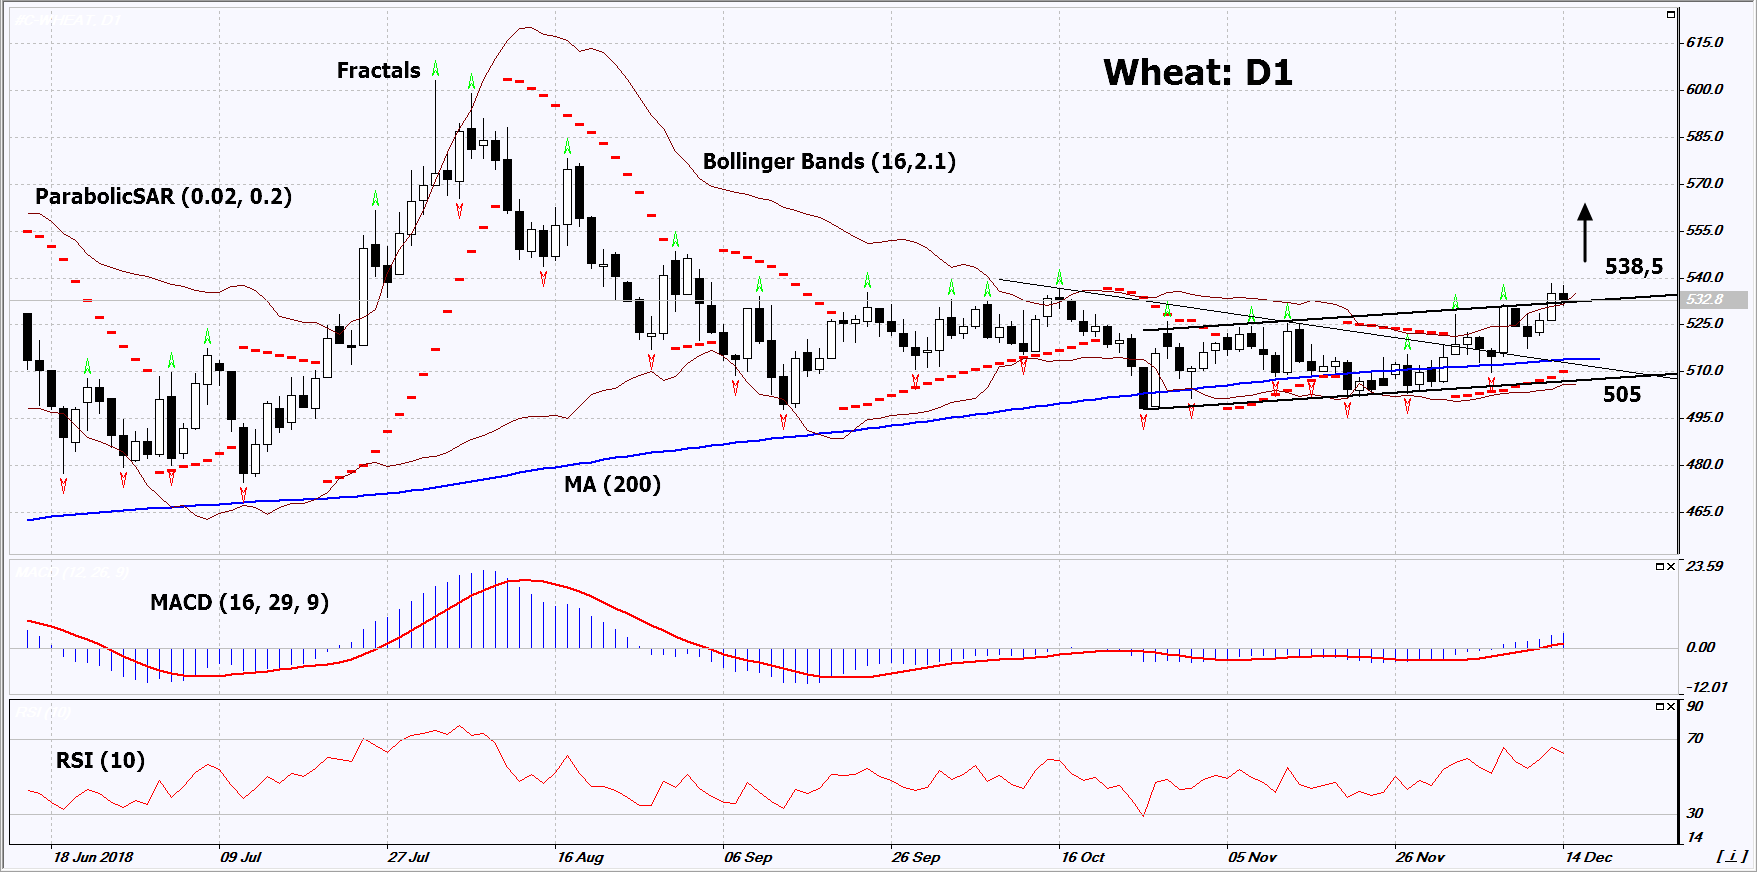
On the daily timeframe, Wheat: D1 is in a rising trend. It breached up the upper line of the rising channel and the movement can accelerate. The further price growth is possible in case of a reduction in the world wheat harvest and an increase in demand.
- The Parabolic indicator gives a bullish signal.
- The Bollinger bands are widening strongly, which indicates high volatility. Both bands are titled upward.
- The RSI indicator above 50. No divergence.
- The MACD indicator gives a bullish signal.
The bullish momentum may develop in case Wheat exceeds its last high at 538.5. This level may serve as an entry point. The initial stop loss may be placed below the last fractal low, the Parabolic signal and the lower Bollinger band at 505. After opening the pending order, we shall move the stop to the next fractal low following the Bollinger and Parabolic signals. Thus, we are changing the potential profit/loss to the breakeven point. More risk-averse traders may switch to the 4-hour chart after the trade and place there a stop loss moving it in the direction of the trade. If the price meets the stop level (505) without reaching the order (538.5), we recommend to close the position: the market sustains internal changes that were not taken into account.
Summary of technical analysis
| Position | Buy |
| Buy stop | Above 538.5 |
| Stop loss | Below 505 |
- 取得證書

附注:
本文針對宣傳和教育, 是免費讀物. 文中所包含的資訊來自於公共管道. 不保障資訊的完整性和準確性. 部分文章不會更新. 所有的資訊, 包括觀點, 指數, 圖表等等僅用於介紹, 不能用於財務意見和建議. 所有的文字以及圖表不能作為交易的建議. IFC Markets及員工在任何情況下不會對讀者在閱讀文章中或之後採取的行為負責.
