- 分析
- 技術分析
納斯達克指數 - NDX100 技術分析 - 納斯達克指數 - NDX100 交易: 2019-06-19
Positive data bullish for Nd100
US retail sales and industrial production rose in May. Will the Nd100 stock index continue advancing?
US economic data were positive on balance ahead of Federal Reserve meeting: US retail sales grew 0.5% in May, and sales were revised to 0.3% growth for April after an initial estimate of 0.2% decline. US industrial production rose 0.4% in May, when 0.2% rise was expected, and utilization edged up 0.2 percentage point to 78.1%. And while home builder confidence declined slightly in June, it still recorded improvement: the reading from the National Association of Home Builders survey for June showed that home builder confidence fell two points to 64 in June. However, any reading over 50 signals improvement. At the time the Federal Reserve is viewed to be leaning toward easing after prolonged US-China tariff standoff damped market sentiment positive economic data are bullish for US equities market.
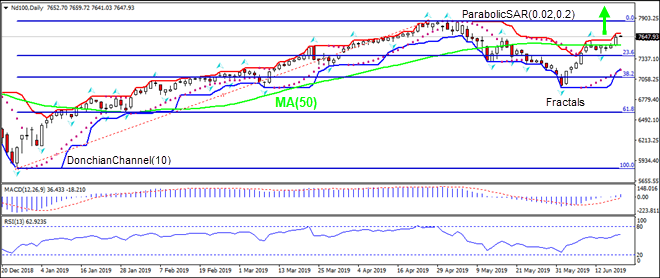
On the daily timeframe Nd100: D1 is rising after closing below Fibonacci 38.2 level. It has returned above 50-day moving average MA(50). These are bullish developments.
- The Donchian channel indicates uptrend: it is tilted up.
- The Parabolic indicator has formed a buy signal.
- The MACD indicator is above the signal line and the gap is widening, which is a bullish signal.
- The RSI oscillator is rising but has not reached the overbought zone.
We believe the bullish momentum will continue as the price breaches above the upper boundary of Donchian channel at 7688.09. This level can be used as an entry point for placing a pending order to buy. The stop loss can be placed below the lower Donchian boundary at 7417.51. After placing the order, the stop loss is to be moved every day to the next fractal low, following Parabolic signals. Thus, we are changing the expected profit/loss ratio to the breakeven point. If the price meets the stop loss level (7417.51) without reaching the order (7688.09), we recommend cancelling the order: the market has undergone internal changes which were not taken into account.
Technical Analysis Summary
| Order | Buy |
| Buy stop | Above 7688.09 |
| Stop loss | Below 7417.51 |
- 取得證書

附注:
本文針對宣傳和教育, 是免費讀物. 文中所包含的資訊來自於公共管道. 不保障資訊的完整性和準確性. 部分文章不會更新. 所有的資訊, 包括觀點, 指數, 圖表等等僅用於介紹, 不能用於財務意見和建議. 所有的文字以及圖表不能作為交易的建議. IFC Markets及員工在任何情況下不會對讀者在閱讀文章中或之後採取的行為負責.
