GBP/USD 技術分析 | GBP/USD 交易: 2014-12-01 | IFCM
IFC Markets - 外匯交易

GBP/USD 技術分析 - GBP/USD 交易: 2014-12-01

OPEC: dollar appreciation

The fallen oil futures prices after the OPEC meeting resulted in a significant depreciation of commodity currencies against the US dollar: it was in favour of USD and led to a significant strengthening of the dollar index. Today at 14:00 CET we expect the monthly release of ISM Manufacturing PMI in the United States. This diffusion index is based on a survey of 400 purchasing managers in the manufacturing industry, which evaluate employment, output volume, orders and stockpiles. It is the most important economic indicator as it permits obtaining preliminary information on manufacturing activity which affects the investor optimism. In our opinion, the greatest volatility is expected today from the US currency relative to other liquid instruments of the currency market.
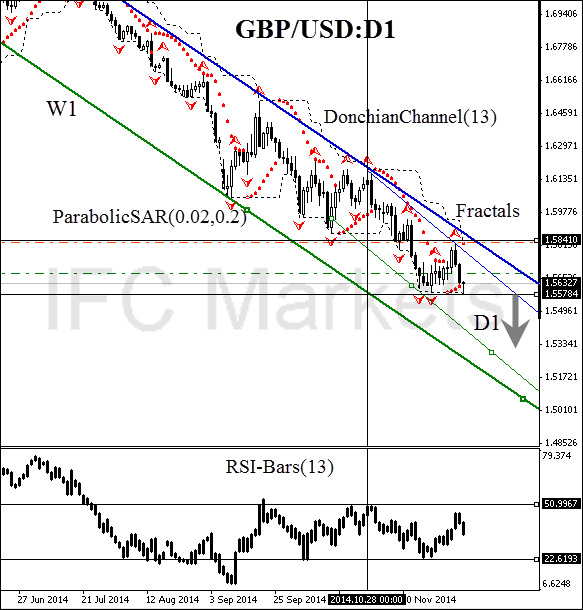
technical-analysis-charts-GBP-USD

Here we consider the GBP/USD currency pair on the D1 chart. The price is preparing to move in the direction of the red zone, as evidenced by the Parabolic reversal. The fractal resistance level at 1.58410 is crossing the daily bearish trend line, which makes this mark suitable for reliable risk mitigation of a short position. This level is also confirmed by the upper Donchian Channel boundary. A pending sell order can be placed below 1.55784, which is confirmed by Parabolic historical values and the Bill Williams fractal. Conservative traders are recommended to look for the RSI-Bars support level breakout at 22.6194%. This signal must confirm the opening of a pending order. We can see the volume of futures traded on Chicago Mercantile Exchange outperformed the highest level of 125000 contracts: the downtrend is likely to maintain. The trading volume confirms the birth of a new trend.

technical-analysis-charts-GBP-USD

After position opening, Stop Loss is to be moved after the Parabolic values, near the next fractal high. Updating is enough to be done every day after a new Bill Williams fractal formation (5 candlesticks). Thus, we are changing the probable profit/loss ratio to the breakeven point.
PositionSell
Sell stopbelow 1.55784
Stop lossabove 1.58410

Dear traders. For the detailed report of the strategy based on analytical issues of technical analysis click here.


IFCM 交易學院-外匯教育的新時代
通過你的課程:
  • 取得證書
trading academy

為客戶提供最佳的交易條件和高水準的服務

我們隨時準備為您提供全天候24小時的服務.

附注:
本文針對宣傳和教育, 是免費讀物. 文中所包含的資訊來自於公共管道. 不保障資訊的完整性和準確性. 部分文章不會更新. 所有的資訊, 包括觀點, 指數, 圖表等等僅用於介紹, 不能用於財務意見和建議. 所有的文字以及圖表不能作為交易的建議. IFC Markets及員工在任何情況下不會對讀者在閱讀文章中或之後採取的行為負責.

Close support
Call to Skype Call to QQ Call Back