- 分析
- 技術分析
法國股指 技術分析 - 法國股指 交易: 2019-08-05
New US sanctions against China caused the fall of global stock markets
The French industrial PMI dropped in July. Will the decline of FR40 quotations continue?
The French macroeconomic indicator Markit Manufacturing PMI in July this year dropped to 49.7 points. This is worse than a preliminary forecast of 50 points. In general, the global stock markets are experiencing a decrease in quotations against the background of another exacerbation of the US-Chinese trade war. US President Donald Trump announced a duty increase of 10% from September 1, 2019 on imports of Chinese goods worth $ 300 billion a year. The fall of the FR40 index last week was the maximum since October 2018. The current P / E level (capitalization / total net profit for the year) of the index is 17.5. He is now 13.3% higher than the level at the beginning of 2019.
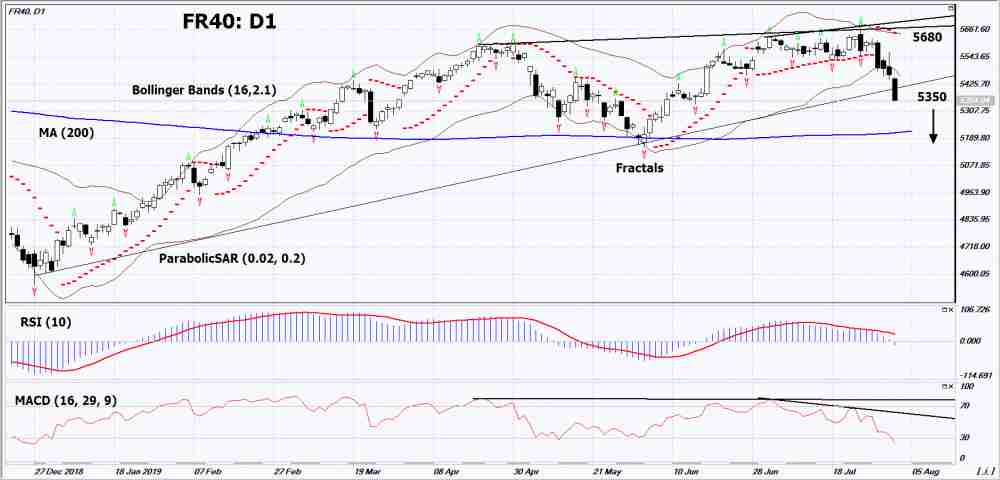
On the daily timeframe FR40: D1 broke through the support line of the medium-term uptrend. A number of technical analysis indicators formed signals for lowering. A further drop in quotations is possible in case of worsening trade wars and their negative impact on the world and French economies.
- The Parabolic indicator gives a downtrend signal.
- The Bolinger bands widened, indicating a volatility increase. Both lines slope down.
- The RSI indicator is below 30. It formed a divergence towards to fall.
- The MACD indicator gives a bearish signal.
The bearish momentum may develop if FR40 drops below its last low: 5350. This level can be used as an entry point. The initial stop lose may be set higher than the last upper fractal, the maximum since December 2007, the upper Bollinger line and the Parabolic signal: 5680. After opening the pending order, stop shall be moved following the Bollinger and Parabolic signals to the next fractal minimum. Thus, we are changing the potential profit/loss to the breakeven point. More risk-averse traders may switch to the 4-hour chart after the trade and place a stop loss moving it in the direction of the trade. If the price meets the stop level (5680) without reaching the order (5350), we recommend to cancel the order: the market sustains internal changes that were not taken into account.
Technical Analysis Summary
| Position | Sell |
| Sell stop | Below 5350 |
| Stop loss | Above 5680 |
- 取得證書

附注:
本文針對宣傳和教育, 是免費讀物. 文中所包含的資訊來自於公共管道. 不保障資訊的完整性和準確性. 部分文章不會更新. 所有的資訊, 包括觀點, 指數, 圖表等等僅用於介紹, 不能用於財務意見和建議. 所有的文字以及圖表不能作為交易的建議. IFC Markets及員工在任何情況下不會對讀者在閱讀文章中或之後採取的行為負責.
