- 分析
- 技術分析
EUR/USD 技術分析 - EUR/USD 交易: 2015-07-20
EUR/USD currency pair sustains the trend
Let us consider the EUR/USD currency pair on the H4 chart. At the moment we observe a continuing bearish trend, determined by the eurozone crisis and the technical default in Greece. The price has breached the important support line at 1.09186 and successfully consolidated below this level. The mark now acts as a resistance line. Donchian Channel confirms the major trend. RSI-Bars assures our assumptions as well. However, we see a slight rebound.
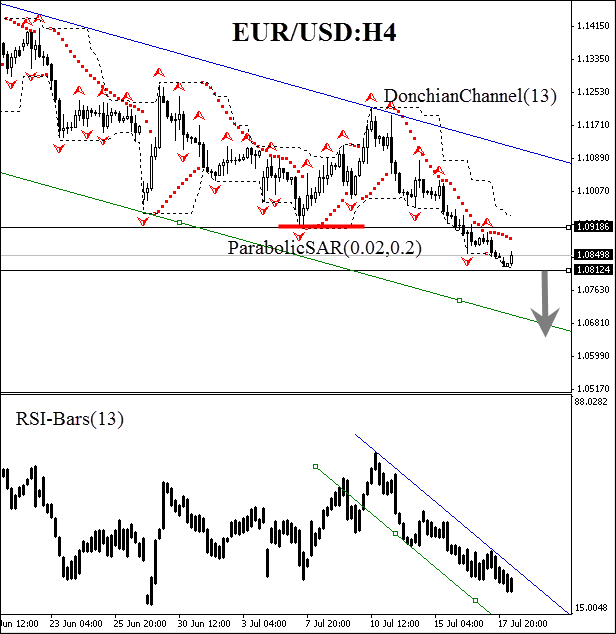
We believe that all the represented analysis tools have been giving bearish signals. Conservative traders are recommended to wait until the next support line is crossed at 1.08124. This mark is supported by the Donchian Channel lower boundary. We can place a sell pending order there. A stop loss may be placed at the Donchian opposite boundary at 1.09186. This level is confirmed by Parabolic historical values and Bill Williams fractal. The stop loss is supposed to be moved every four hours to the next fractal high, following Parabolic signals. Thus, we change the probable profit/loss ratio to the breakeven point.
| Position | Sell |
| Sell stop | below 1.08124 |
| Stop loss | above 1.09186 |
- 取得證書

附注:
本文針對宣傳和教育, 是免費讀物. 文中所包含的資訊來自於公共管道. 不保障資訊的完整性和準確性. 部分文章不會更新. 所有的資訊, 包括觀點, 指數, 圖表等等僅用於介紹, 不能用於財務意見和建議. 所有的文字以及圖表不能作為交易的建議. IFC Markets及員工在任何情況下不會對讀者在閱讀文章中或之後採取的行為負責.
