- 分析
- 技術分析
EUR/GBP 技術分析 - EUR/GBP 交易: 2018-07-09
Will there be a soft Brexit?
Market participants believe that the UK will not be able to agree with European officials on a number of benefits in case of the withdrawal from the EU. Will the EURGBP grow, if there will not be the so-called "soft Brexit"?
British Prime Minister Teresa May will present her plan for Brexit in the parliament of her country on Friday night. Earlier, British Foreign Secretary Boris Johnson and former Prime Minister (2010-2016) David Cameron said that it is the worst of all possible options. In addition, according to The Guardian, the head of the British Brexit commission David Davis said that the new customs proposals of Therese May look "unworkable" and expressed the view that the EU would reject her plan. In July 10, significant macroeconomic indicators for May will be published in the UK: the industrial production, the monthly GDP and the trade balance. It should be emphasized that the success of the UK in negotiations on the withdrawal from the EU can reverse EURGBP down. An important factor may be the visit of Donald Trump to Great Britain on July 12.
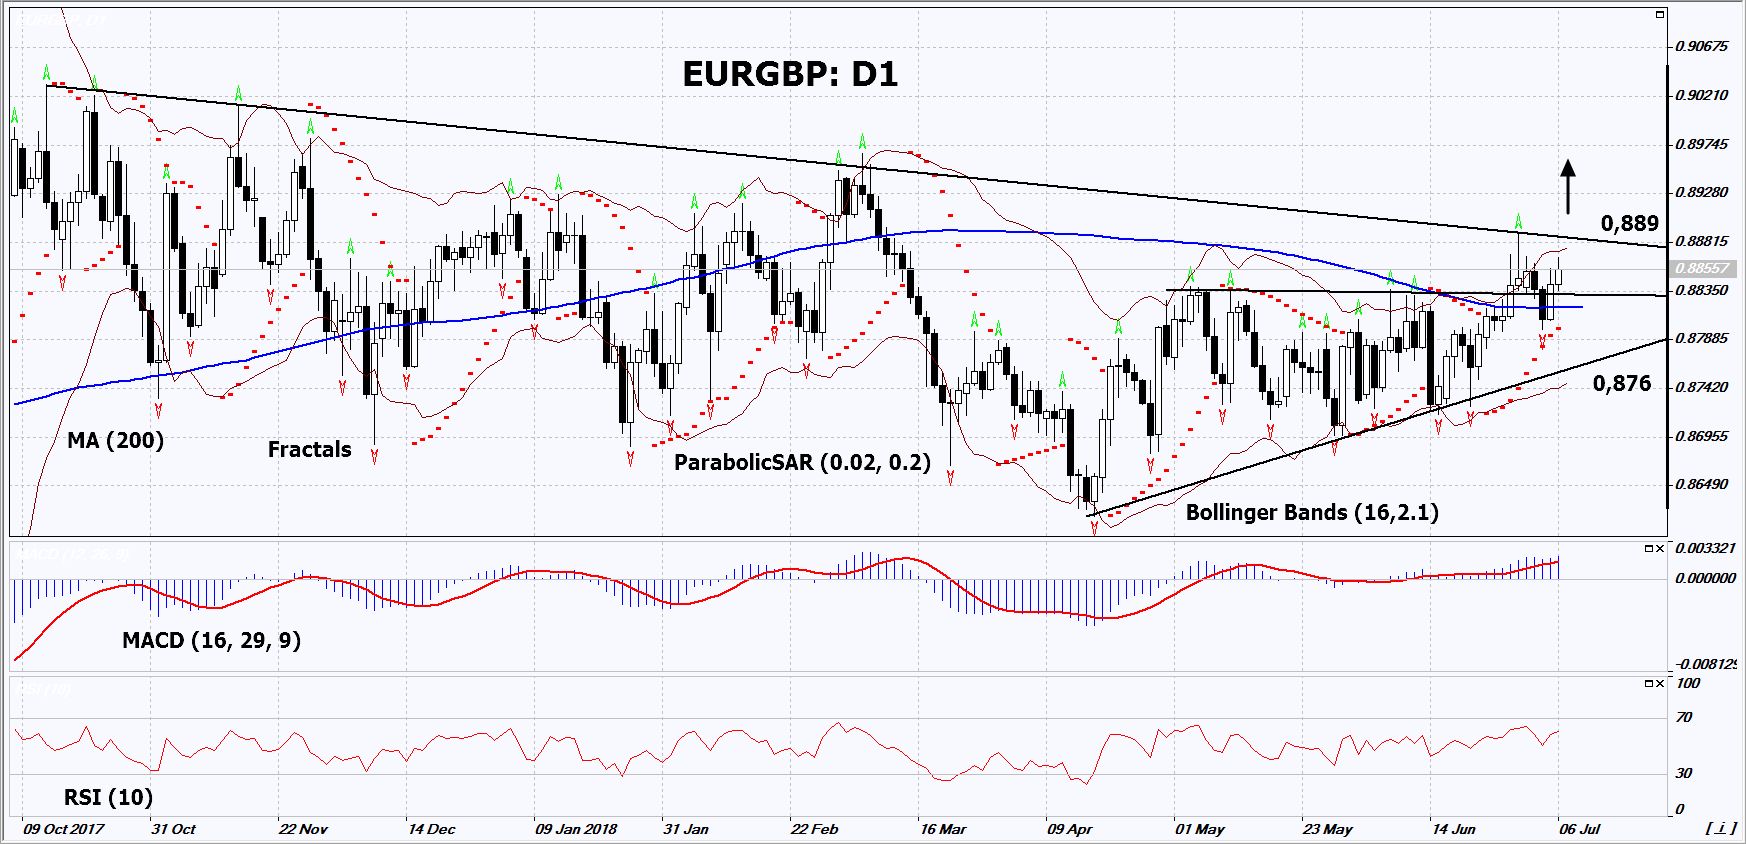
On the daily timeframe, EURGBP: D1 is trying to move upward from the triangle and has approached the resistance line of the long-term falling channel. It should be breached up before opening a buy position. The further price increase is possible in case of successful negotiations on Brexit for the UK.
- The Parabolic indicator gives a bullish signal.
- The Bollinger bands have widened, which indicates high volatility. They are titled upward.
- The RSI indicator is above 50. No divergence.
- The MACD indicator gives a bullish signal.
The bullish momentum may develop in case EURGBP exceeds the last high, the upper Bollinger band and the resistance line of the downtrend at 0.889. This level may serve as an entry point. The initial stop loss may be placed below the last fractal low, the 200-day moving average line, the Parabolic signal and the support line of the triangle at 0.876. After opening the pending order, we shall move the stop to the next fractal low following the Bollinger and Parabolic signals. Thus, we are changing the potential profit/loss to the breakeven point. More risk-averse traders may switch to the 4-hour chart after the trade and place there a stop loss moving it in the direction of the trade. If the price meets the stop level (0.876) without reaching the order (0.889), we recommend to close the position: the market sustains internal changes that were not taken into account.
Summary of technical analysis
| Position | Buy |
| Buy stop | Above 0.889 |
| Stop loss | Below 0.876 |
- 取得證書

附注:
本文針對宣傳和教育, 是免費讀物. 文中所包含的資訊來自於公共管道. 不保障資訊的完整性和準確性. 部分文章不會更新. 所有的資訊, 包括觀點, 指數, 圖表等等僅用於介紹, 不能用於財務意見和建議. 所有的文字以及圖表不能作為交易的建議. IFC Markets及員工在任何情況下不會對讀者在閱讀文章中或之後採取的行為負責.
