- 分析
- 技術分析
道鐘斯工業平均指數 技術分析 - 道鐘斯工業平均指數 交易: 2019-06-07
Positive US data bullish for DJI
Services sector in US accelerated more than expected as manufacturing sector continued expanding in May. Will the DJI stock index continue advancing?
US data lately were positive on balance: expansion in services sector accelerated more than expected as manufacturing sector continued expanding (albeit at slower than forecast pace) in May. At the same time vehicles sales increased more than forecast in May. These reports were preceded by a Census Bureau report of a stagnant core factory orders (which exclude volatile aircraft orders) in April. And market sentiment was buoyed by Federal Reserve chair Powell’s comment the central bank will ‘ act as appropriate to sustain the expansion’ . At the same time Federal Reserve released its beige book for April through mid-May, which described the U.S. economy as expanding at a “modest pace overall .” Continuing economic growth is bullish for US equities market.
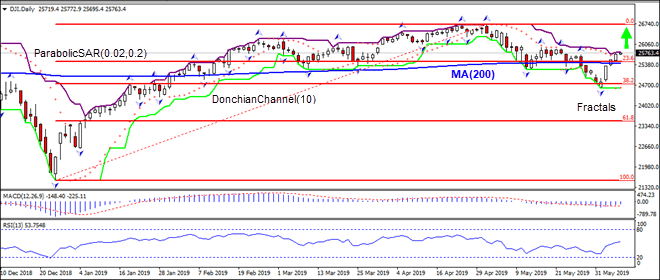
On the daily timeframe DJI: D1 is rising after failing to close below Fibonacci 38.2 level. It has returned above the 200-day moving average MA(200). These are bullish developments.
- The Donchian channel indicates uptrend: it is widening up.
- The Parabolic indicator has formed a buy signal.
- The MACD indicator is below the signal line and the gap is narrowing, which is a bullish signal.
- The RSI oscillator is rising but has not reached the overbought zone.
We believe the bullish momentum will continue as the price breaches above the upper boundary of Donchian channel at 25795.10. This level can be used as an entry point for placing a pending order to buy. The stop loss can be placed below the lower Donchian boundary at 24598.60. After placing the order, the stop loss is to be moved every day to the next fractal low, following Parabolic signals. Thus, we are changing the expected profit/loss ratio to the breakeven point. If the price meets the stop loss level (24598.60) without reaching the order (25795.10), we recommend cancelling the order: the market has undergone internal changes which were not taken into account.
Technical Analysis Summary
| Position | Buy |
| Buy stop | Above 25795.1 |
| Stop loss | Below 24598.6 |
- 取得證書

附注:
本文針對宣傳和教育, 是免費讀物. 文中所包含的資訊來自於公共管道. 不保障資訊的完整性和準確性. 部分文章不會更新. 所有的資訊, 包括觀點, 指數, 圖表等等僅用於介紹, 不能用於財務意見和建議. 所有的文字以及圖表不能作為交易的建議. IFC Markets及員工在任何情況下不會對讀者在閱讀文章中或之後採取的行為負責.
