- 分析
- 技術分析
道鐘斯工業平均指數 技術分析 - 道鐘斯工業平均指數 交易: 2019-02-07
Strong data bullish for DJI
Dow Jones Industrial Average (30), 股票指數 圖表分析
, 股票指數 圖表分析")
Dow Jones Industrial Average (30), 股票指數 技術分析
Continuing expansion in private sector indicates US economy is strong. Will the DJI continue the rebound?
Data after the Federal Reserve January 29-30 meeting were positive on balance indicating the US economy is strong. The Institute of Supply Management's manufacturing index’s final reading for January came in better than expected. The US economy created above-expected 304,000 new jobs in January as labor force participation rose. And while the services section expansion slowed in January, the expansion still continued at robust pace with employment and prices rising in the sector. The only weak spot were the drop in factory orders for November. Positive economic data are bullish for Dow Jones US stock index.
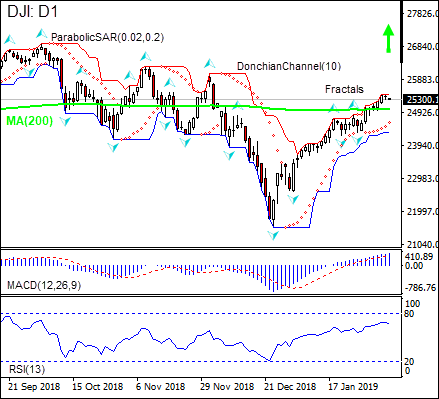
On the daily timeframe the DJI: D1 is above the 200-day moving average MA(200), this is bullish.
- The Parabolic indicator gives a buy signal.
- The Donchian channel indicates no trend yet: it is flat.
- The MACD indicator gives a bullish signal: it is above the signal line and the gap is widening.
- The RSI oscillator is falling but has not reached the oversold zone yet.
We believe the bullish momentum will continue after the price closes above the upper boundary of Donchian channel at 25434.7. This level can be used as an entry point for placing a pending order to buy. The stop loss can be placed below the fractal low at 24315.6. After placing the order, the stop loss is to be moved every day to the next fractal low, following Parabolic signals. Thus, we are changing the expected profit/loss ratio to the breakeven point. If the price meets the stop loss level (24315.6) without reaching the order (25434.7), we recommend cancelling the order: the market has undergone internal changes which were not taken into account.
Technical Analysis Summary
| Position | Buy |
| Buy stop | Above 25434.7 |
| Stop loss | Below 24315.6 |
基本面分析 - "}[/T]
- 取得證書

附注:
本文針對宣傳和教育, 是免費讀物. 文中所包含的資訊來自於公共管道. 不保障資訊的完整性和準確性. 部分文章不會更新. 所有的資訊, 包括觀點, 指數, 圖表等等僅用於介紹, 不能用於財務意見和建議. 所有的文字以及圖表不能作為交易的建議. IFC Markets及員工在任何情況下不會對讀者在閱讀文章中或之後採取的行為負責.
