- 分析
- 技術分析
白銀對墨西哥比索 技術分析 - 白銀對墨西哥比索 交易: 2019-05-14
Getting ready for the bank of Mexico meeting
In this review, we suggest to consider the Silver vs. MXN personal composite instrument (PCI). It reflects the price dynamics of silver against the Mexican peso. Will the XAGMXN quotations grow?
Such dynamics means the rise in silver prices and the weakening of the Mexican peso. May 16, 2019 will be the next meeting of the Bank of Mexico. According to futures quotes, the probability of a rate reduction exceeds 75%. This can have a negative effect on peso dynamics. Inflation in Mexico is 4.41% in annual terms, which is above the target range of the Bank of Mexico (3% plus or minus 1%). However, the current rate is almost 2 times higher than this indicator and is now equal to 8.25%. It is expected to decrease to 8%. In turn, precious metals are becoming more expensive against the backdrop of increasing global political risks and another exacerbation of the US-Chinese trade war.
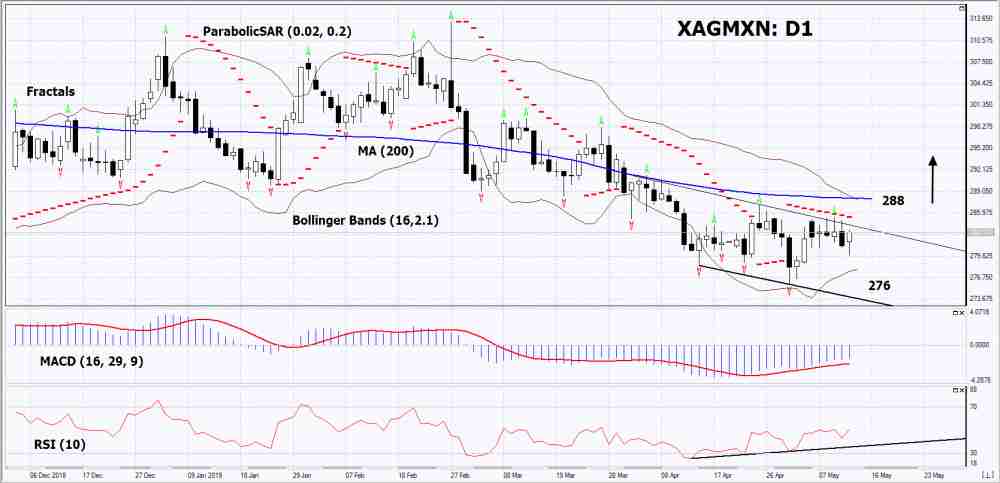
On the daily timeframe, XAGMXN: D1 adjusted to the top of a 6-month low. It approached the resistance line of the downward trend, which needs to be pushed upward before opening a buy position. Most of the technical analysis indicators showed an uptrend signal. Further growth is possible if high demand for precious metals remains and the Bank of Mexico rate decreases.
- The Parabolic indicator demonstrates the signal to decrease. It can be used as a resistance level that must be overcome before opening a buy position.
- The Bollinger bands narrowed, indicating volatility decrease . The bottom line of Bollinger has a slope up.
- The RSI indicator is above the 50 mark. It has formed a divergence to the rise.
- The MACD indicator indicates a signal to increase.
The bullish momentum may develop if XAGMXN will exceed its last two upper fractals, the Parabolic signal, the 200-day moving average line and the upper Bollinger line: 288.This level may serve as an entry point. The initial stop loss may be placed below the last lower fractal, the bottom Bollinger line and the 6-month minimum: 276. After opening the pending order, we shall move the stop to the next fractal low following the Bollinger and Parabolic signals to the next fractal minimum. Thus, we are changing the potential profit/loss to the breakeven point. More risk-averse traders may switch to the 4-hour chart after the trade and place there a stop loss moving it in the direction of the trade. If the price meets the stop level (276) without reaching the order (288), we recommend to close the position: the market sustains internal changes that were not taken into account.
Summary of technical analysis
| Position | Buy |
| Buy stop | Above 288 |
| Stop loss | Below 276 |
- 取得證書

附注:
本文針對宣傳和教育, 是免費讀物. 文中所包含的資訊來自於公共管道. 不保障資訊的完整性和準確性. 部分文章不會更新. 所有的資訊, 包括觀點, 指數, 圖表等等僅用於介紹, 不能用於財務意見和建議. 所有的文字以及圖表不能作為交易的建議. IFC Markets及員工在任何情況下不會對讀者在閱讀文章中或之後採取的行為負責.
