- 分析
- 技術分析
WTI原油/日元 技術分析 - WTI原油/日元 交易: 2018-12-12
Japan's GDP fell according to results of the 3rd quarter
In this review, we suggest considering the personal composite instrument (PCI) &WTI/JPY. It reflects the price dynamics of the portfolio of futures on WTI oil against the Japanese yen. Will the WTI/JPY rise?
Such dynamics means the weakening of the yen and strengthening of oil. The United Auto Workers union has asked the US government to impose import duties on Japanese cars. Theoretically, President Donald Trump may take measures to reduce the trade surplus in favor of Japan, estimated at $ 69 billion per year. Earlier, he raised duties on Chinese goods in order to reduce the trade surplus in favor of China. An additional negative factor for the yen may be weak macroeconomic data. The decrease in Japan’s GDP in the 3rd quarter of 2018 was minus 2.5%, and it has been the maximum since the 2nd quarter of 2014. Oil prices may rise due to the decision of OPEC and non-OPEC producers to reduce oil production by 1.2 million barrels per day from January 1, 2019. In addition, according to the report by the Libyan National Oil Company, Libya may reduce oil production by 388 thousand barrels per day because of the actions of rebels in the El Sharara and El Feel fields.
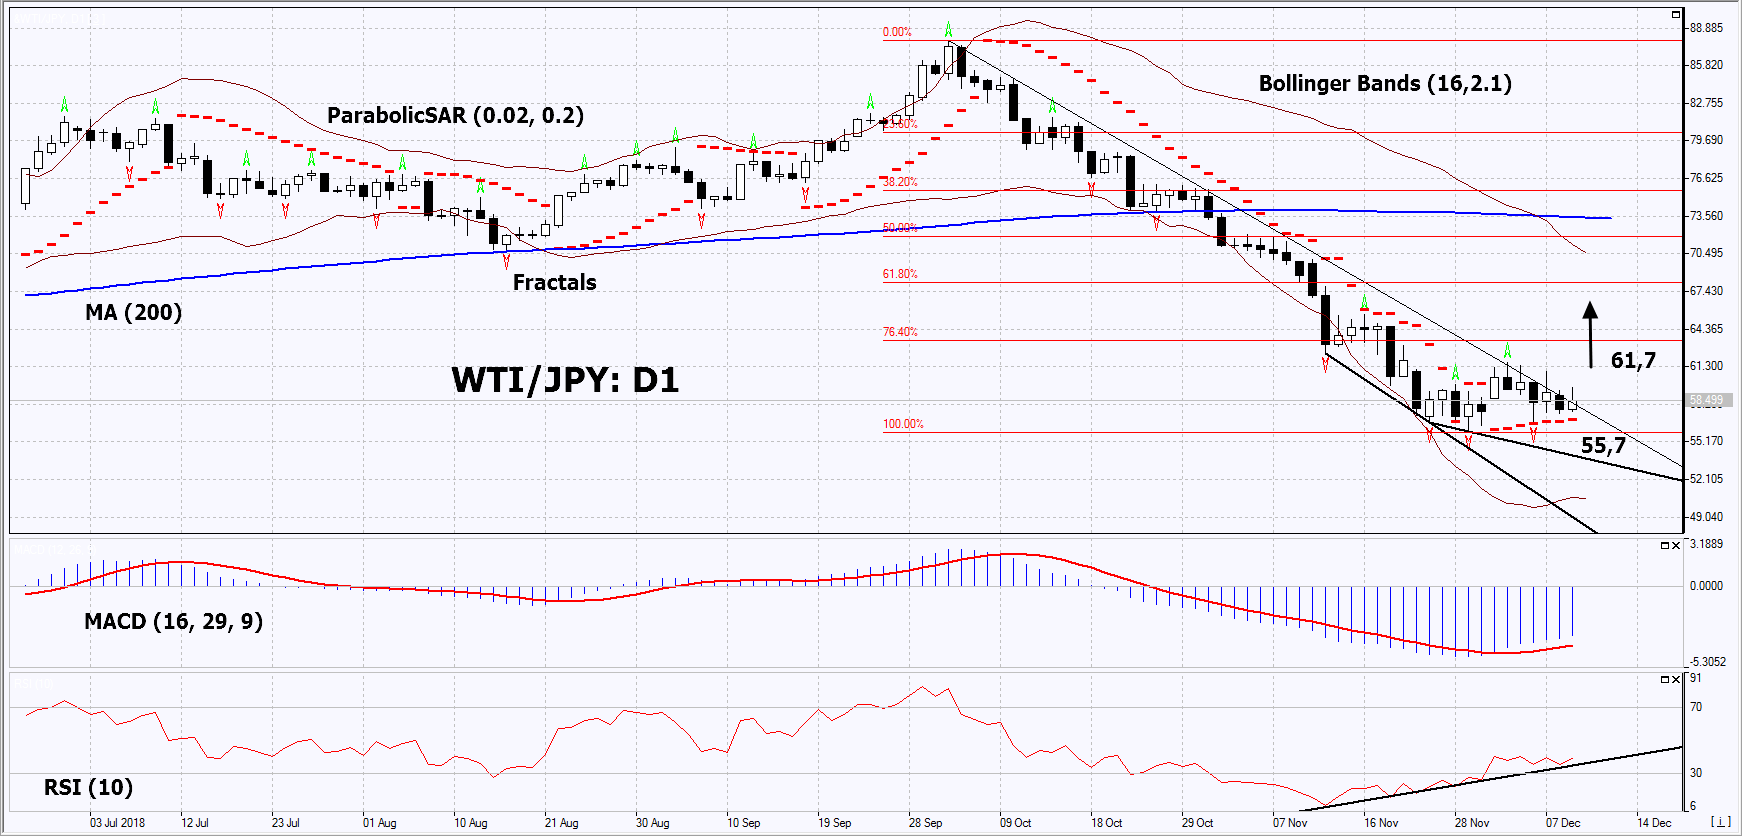
On the daily timeframe, WTI/JPY: D1 in a downtrend. It has approached its resistance line. A number of technical analysis indicators formed buy signals. The resistance line of the downtrend must be breached up before opening a buy position. The further price increase is possible in case of the publication of negative macroeconomic statistics in Japan and a reduction in world oil production.
- The Parabolic indicator gives a bullish signal.
- The Bollinger bands have widened strongly, which indicates high volatility. The lower band is titled upward.
- The RSI indicator is below 50. It has formed a double positive divergence.
- The MACD indicator gives a bullish signal.
The bullish momentum may develop in case WTI/JPY exceeds its last fractal high and the resistance line of the downtrend at 61.7. This level may serve as an entry point. The initial stop loss may be placed below the two last fractal lows, the Parabolic signal and the 14-month low at 55.7. After opening the pending order, we shall move the stop to the next fractal low following the Bollinger and Parabolic signals. Thus, we are changing the potential profit/loss to the breakeven point. More risk-averse traders may switch to the 4-hour chart after the trade and place there a stop loss moving it in the direction of the trade. If the price meets the stop level (55.7) without reaching the order (61.7), we recommend to close the position: the market sustains internal changes that were not taken into account.
Summary of technical analysis
| Position | Buy |
| Buy stop | Above 61.7 |
| Stop loss | Below 55.7 |
- 取得證書

附注:
本文針對宣傳和教育, 是免費讀物. 文中所包含的資訊來自於公共管道. 不保障資訊的完整性和準確性. 部分文章不會更新. 所有的資訊, 包括觀點, 指數, 圖表等等僅用於介紹, 不能用於財務意見和建議. 所有的文字以及圖表不能作為交易的建議. IFC Markets及員工在任何情況下不會對讀者在閱讀文章中或之後採取的行為負責.
