- 分析
- 技術分析
美元指數 技術分析 - 美元指數 交易: 2017-01-10
Investors undecided on the direction of the market movement yet
The US dollar index is correcting down from its 14-year high recorded last week. Will it continue falling? Significant economic data in the US are expected only on Friday.
The weakening of the US dollar started on January 4, 2017 after the publication of the Fed December meeting minutes. They indicated a likelihood of an increase in inflation risks on the background of accelerated economic growth and possible reduction of the US corporate tax burden in case of an approval of the economic program of the new US president Donald Trump. Some investors even declared about the “overheating” risks of the US economy. Another factors in favor of the possible correction of the US dollar index may become data on the US labor market. The average increase in US nonfarm payrolls was 180 thousand a month in 2016 which is far below the benchmark of 229 thousand a month in 2015. The slowdown in nonfarm payrolls may also signify the risk of US economic overheating and full employment. Meanwhile, the US inflation reached 2.1% having exceeded the Fed target level of 2%. Theoretically, such economic indicators can limit the potential of rate hike.
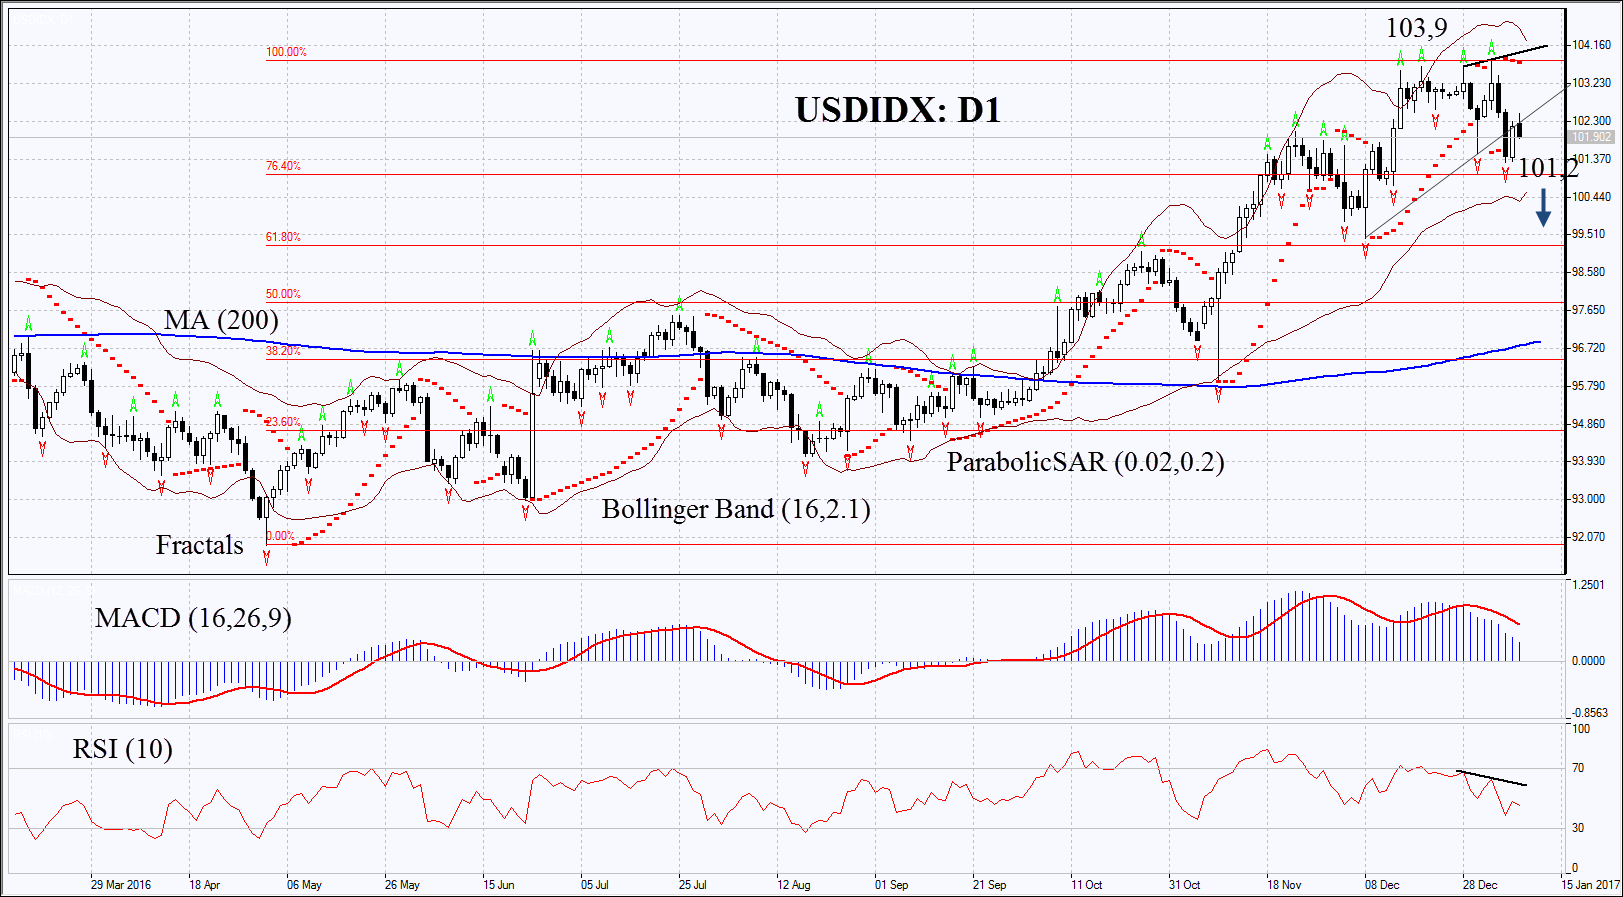
On the daily chart USDIDX: D1 has left the rising trend nd is correcting down from its 14-year highю Further decline is possible in case of negative economic data in US.
- Parabolic indicator gives a bearish signal.
- Bollinger bands have widened which indicates high volatility.
- RSI indicator is below 50. It has formed negative divergence.
- MACD indicator gives a bearish signal.
The bearish momentum may develop in case USDIDX falls below the last fractal low at 101.2. This level may serve as the point of entry. The initial stop-loss may be placed above the 14-year high and the Parabolic signal at 103.9. Psychological levels of 101 and 104 can also be used. After opening the pending order we shall move the stop to the next fractal high following the Parabolic and Bollinger signals. Thus, we are changing the probable profit/loss ratio to the breakeven point. The most risk-averse traders may switch to the 4-hour chart after the trade and place there a stop-loss moving it in the direction of the trade. If the price meets the stop-loss level at 103.9 without reaching the order at 101.2, we recommend cancelling the position: the market sustains internal changes which were not taken into account.
Summary of technical analysis
| Position | Sell |
| Sell stop | Below 101,2 |
| Stop loss | Above 103,9 |
- 取得證書

附注:
本文針對宣傳和教育, 是免費讀物. 文中所包含的資訊來自於公共管道. 不保障資訊的完整性和準確性. 部分文章不會更新. 所有的資訊, 包括觀點, 指數, 圖表等等僅用於介紹, 不能用於財務意見和建議. 所有的文字以及圖表不能作為交易的建議. IFC Markets及員工在任何情況下不會對讀者在閱讀文章中或之後採取的行為負責.
