- 分析
- 技術分析
USD/JPY 技術分析 - USD/JPY 交易: 2019-04-15
Sales tax may be increased in Japan
The Japanese government is going to increase the sales tax to 10% from 8%. Will the quotations for USDJPY increase?
Such a move indicates the weakening of yen against the US dollar. Sales tax is applied in Japan instead of VAT. Its previous increase from 5% to 8% was implemented on April 1, 2014, but was announced about six months before. In 2014, the increase in sales tax contributed to the weakening of the exchange rate from 100 to 125 yen per US dollar. In 2019 the sales tax can be raised from October 1. An additional negative factor for the yen may be the statement by the Minister of Finance of Japan Taro Aso about the increased risks of a slowdown in the global economy, which he made at a meeting of finance ministers and heads of central banks of the G20 countries. He also noted that even the level of sales tax of 10% is still low compared to world standards. Important macroeconomic data will be released in Japan on April 17 and 19: the trade balance and inflation for March. It can affect the dynamics of the yen.
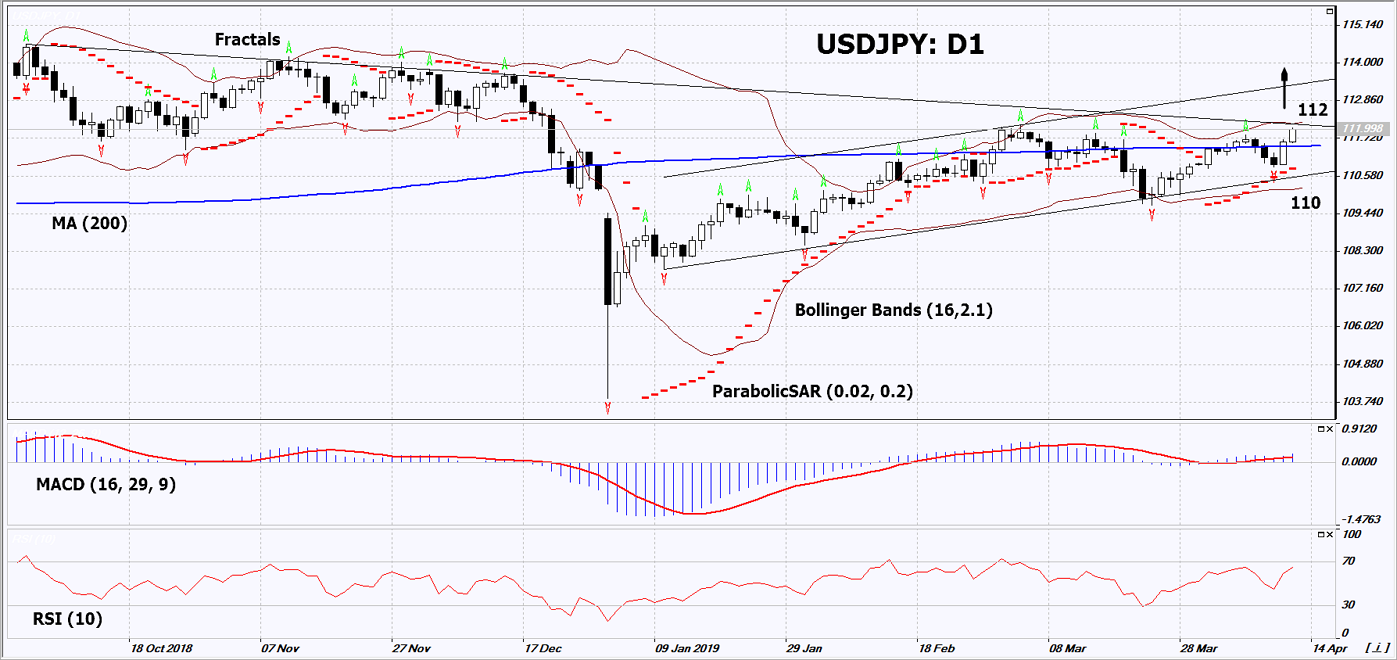
On the daily timeframe, USDJPY: D1 is in a growing trend. Various technical analysis indicators have formed an uptrend. Further growth of quotations is possible in case of publication of negative macroeconomic data in Japan.
- The Parabolic indicator has formed a buy signal.
- The Bollinger Bands narrowed, indicating a decrease in volatility. Both lines of Bollinger have a slope up
- The RSI indicator is above 50. No divergence has been formed.
- The MACD indicator gives a bullish signal.
The bullish momentum may develop in case if USDJPY exceeds the upper Bollinger band and 4 last upper fractals: 112,21. This level may serve as an entry point. The initial stop loss may be placed below 200-day moving average line, Parabolic signal and the lower Bollinger line: 110. After opening a pending order, we shall move the stop to the next fractal low following the Bollinger and Parabolic signals. Thus, we are changing the potential profit/loss to the breakeven point. More risk-averse traders may switch to the 4-hour chart after the trade and place there a stop loss moving it in the direction of the trade. If the price meets the stop level (110), without reaching the order (112,21), we recommend to delete the order: the market sustains internal changes that were not taken into account.
Technical Analysis Summary
| Position | Buy |
| Buy stop | Above 112,21 |
| Stop loss | Below 110 |
- 取得證書

附注:
本文針對宣傳和教育, 是免費讀物. 文中所包含的資訊來自於公共管道. 不保障資訊的完整性和準確性. 部分文章不會更新. 所有的資訊, 包括觀點, 指數, 圖表等等僅用於介紹, 不能用於財務意見和建議. 所有的文字以及圖表不能作為交易的建議. IFC Markets及員工在任何情況下不會對讀者在閱讀文章中或之後採取的行為負責.
