- 分析
- 技術分析
USD/CAD 技術分析 - USD/CAD 交易: 2019-10-09
Positive Canadian data bearish for USDCAD
Recent Canadian housing data were better than expected. Will the USDCAD decline?
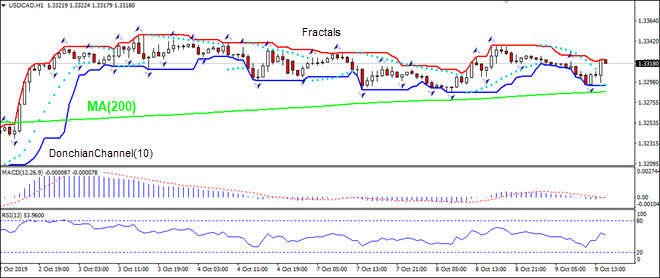
The price chart on 1-hour timeframe shows USDCAD: H1 is trading sideways. The price is above the 200-period moving average MA(200) which is rising. And the RSI is above 50 level but has not reached the overbought zone. There is no trend yet formed, traders have to decide when it would be a best time to enter the market.
- 取得證書

附注:
本文針對宣傳和教育, 是免費讀物. 文中所包含的資訊來自於公共管道. 不保障資訊的完整性和準確性. 部分文章不會更新. 所有的資訊, 包括觀點, 指數, 圖表等等僅用於介紹, 不能用於財務意見和建議. 所有的文字以及圖表不能作為交易的建議. IFC Markets及員工在任何情況下不會對讀者在閱讀文章中或之後採取的行為負責.
