- 分析
- 技術分析
大豆 技術分析 - 大豆 交易: 2015-07-10
Growth may continue
We would like to present you the continuous SOYB CFD. In mid-June the price fell to the 6-year low and then rebounded. At the moment the futures is advancing after a slight pullback, following heavy rains In the Middle West of the US. Market participants expect crop forecasts to be cut. Besides, there are additional factors that underpin the quotes. American National Weather Service said there is 90% chance of El Nino continuing through the winter. There is 80% chance it will last through the spring. Several Japanese weather agencies expressed the same opinion. El Nino causes droughts and floods in Pacific Region, damaging crops. Soybean plantings in India are in danger in case of drought. The country is the second largest soy bean producer after China. The beans are planted in June and July. Rains in August and September are necessary to harvest the biggest crops. Besides, the Chinese government cut a number of rates to stimulate economy. Economic recovery may raise the demand for soy bean as well. It is worth mentioning that on Friday US Department of Agriculture (USDA) released a monthly report. The survey lowered soy bean reserves forecast (2015/2016) from 475mln to 425mln bushels. However, most investors estimated the more significant contraction to 370mln bushels. The official crops forecast for the season 2015/2016 amounted to 3885bln bushels, while market participants anticipated 3776bln bushels. Yet, we suppose that the quotes may rise since the current weather conditions affect them more than the long-term survey by USDA. After all, the official forecasts were cut even though not as much as expected.
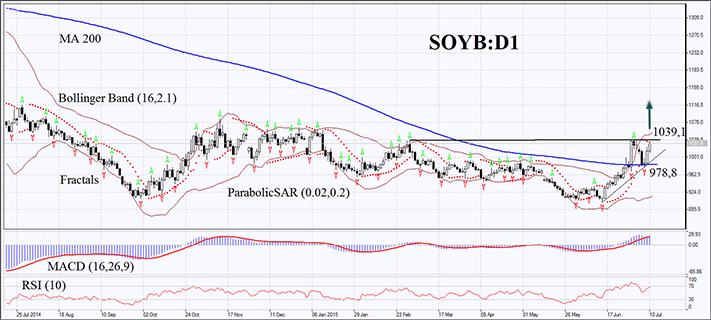
On the daily time frame the SOYB continuous CFD preserves the bullish trend. Last week it demonstrated a pullback. However the quotes did not manage to cross down the 200-day Moving Average and continued growing. Yet, the Parabolic Indicator has been giving sell signals. MACD did not react to the pullback and has been giving buy signals. Bollinger Bands intensely expanded, indicating volatility growth and trend strengthening. The bullish momentum may continue if the price breaches the previous maximum and the latest fractal high at 1039.1. A stop loss may be placed below the latest fractal low and the 200-day Moving Average at 978.8. After pending order activation the stop loss is supposed to be moved every four hours to the next fractal low, following Bollinger and Parabolic signals. Thus, we are changing the probable profit/loss ratio to the breakeven point. Most cautious traders may switch to the H4 time frame and place a stop loss, moving it after the trend. If the price reaches the stop loss without triggering the order, we recommend to cancel the position: the market sustains internal changes that were not considered.
| Position | Buy |
| Buy stop | above 1039.1 |
| Stop loss | below 978.8 |
- 取得證書

附注:
本文針對宣傳和教育, 是免費讀物. 文中所包含的資訊來自於公共管道. 不保障資訊的完整性和準確性. 部分文章不會更新. 所有的資訊, 包括觀點, 指數, 圖表等等僅用於介紹, 不能用於財務意見和建議. 所有的文字以及圖表不能作為交易的建議. IFC Markets及員工在任何情況下不會對讀者在閱讀文章中或之後採取的行為負責.
