- 分析
- 技術分析
NZD/CAD 技術分析 - NZD/CAD 交易: 2019-10-09
Weak construction data is published in Canada
The number of housing starts in Canada decreased in September by 2.5% compared with August and amounted to 221.2 thousand. Will the NZDCAD quotations grow?
Such movement is observed with the strengthening of the New Zealand dollar and the weakening of the Canadian dollar. According to the Canadian Mortgage and Housing Corporation, the volume of new construction of individual urban houses decreased by 9%. Earlier, Canadian business activity indicator Ivey PMI for September fell to a minimum since March 2015 and amounted to 48.7 points. These negative factors may prompt the Bank of Canada to lower the rate at the next meeting on October 30, 2019. Now it is 1.75% with inflation of 1.9% in annual terms. September 11, Canada will release important labor market data for September. Preliminary forecasts are neutral. The US share in Canadian exports in August reached 75%. The main commodity is oil. Accordingly, the decline in world prices for it, as well as possible problems in the US-China trade negotiations, could adversely affect the dynamics of the Canadian dollar. The main trading partner of New Zealand is China and the dynamics of its currency will also depend on negotiations between the United States and China. A positive factor for the New Zealand dollar is government data on a reduction in net debt in the fiscal year 2019/20 to 19.2% of GDP, which is better than the forecast of 20%, as well as a budget surplus of NZ $ 7.5 billion.
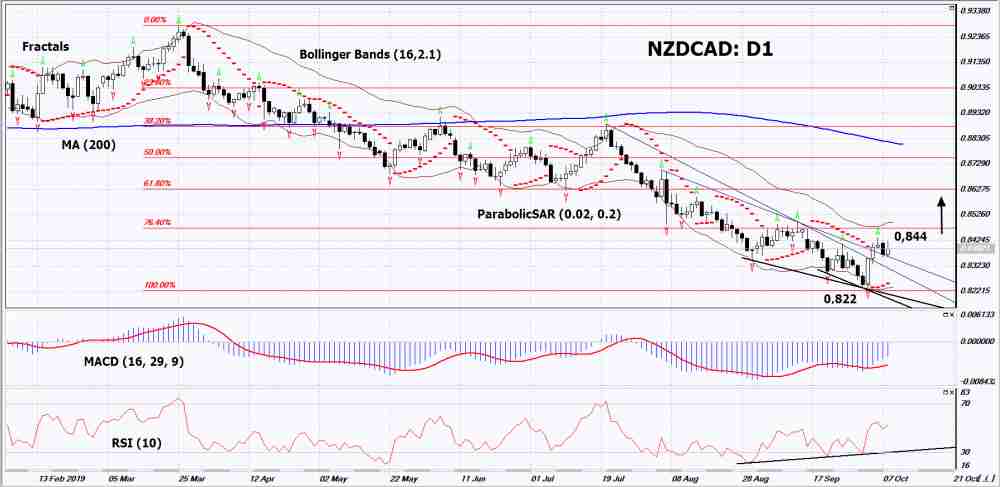
On the daily timeframe NZDCAD: D1 adjusts above from the minimum since April 2014. It has come out of a downtrend and various technical analysis indicators have formed signals to increase. Further growth of quotations is possible if positive macroeconomic data is published in New Zealand and negative - in Canada.
- The Parabolic indicator gives an uptrend signal.
- The Bolinger bands narrowed, indicating a volatility decrease. Both Bollinger Lines Slope Up.
- The RSI indicator is above the 50 mark. It has formed a double divergence to increase.
- The MACD indicator gives a bullish signal.
The bullish momentum may develop if NZDCAD exceeds its last upper fractal: 0.844. This level can be used as an entry point. The initial stop lose may be placed below the minimum since April 2014, the lower Bollinger line, the Parabolic signal and the last lower fractal: 0.822. After opening the pending order, the stop shall be moved following the Bollinger and Parabolic signals to the next fractal minimum. Thus, we are changing the potential profit/loss to the breakeven point. More risk-averse traders may switch to the 4-hour chart after the trade and place a stop loss moving it in the direction of the trade. If the price meets the stop level (0,822) without reaching the order (0,844), we recommend to cancel the order: the market sustains internal changes that were not taken into account.
Technical Analysis Summary
| Position | Buy |
| Buy stop | Above 0,844 |
| Stop loss | Below 0,822 |
- 取得證書

附注:
本文針對宣傳和教育, 是免費讀物. 文中所包含的資訊來自於公共管道. 不保障資訊的完整性和準確性. 部分文章不會更新. 所有的資訊, 包括觀點, 指數, 圖表等等僅用於介紹, 不能用於財務意見和建議. 所有的文字以及圖表不能作為交易的建議. IFC Markets及員工在任何情況下不會對讀者在閱讀文章中或之後採取的行為負責.
