- 分析
- 技術分析
天然氣 技術分析 - 天然氣 交易: 2019-05-13
Exports for the liquefied natural gas of USA grow
Exports of liquefied natural gas (LNG) of the United States in 2018 increased by 61%. Will the NATGAS quotations grow?
Last year, the United States ranked 4th in the world in terms of LNG exports. On May 10, 2019, the United States increased import duties on Chinese goods worth $ 200 billion from 10% to 25%. Initially, this increase was planned on January 1, 2019. Thus, it was expected %. For sure China will respond. However, the export of American LNG is unlikely to suffer, since, basically, it falls on European countries. This week, LNG supplies abroad are more than 1.5 times higher than last year’s level. In addition, the reduction in exports to China is already taken into account in current quotes. In January-April 2019, only 2 tankers with American LNG were sent to China, whereas in the same period of 2018 there were 14. Compared to last year, gas production in the United States is now 10.5% more and total demand - so far only by 7%.The difference between the produced and used volumes of gas enters the reserves and increases them. However, natural gas reserves in the United States are 1.651 trillion cubic feet, which is 14.9% less than the 5-year average.
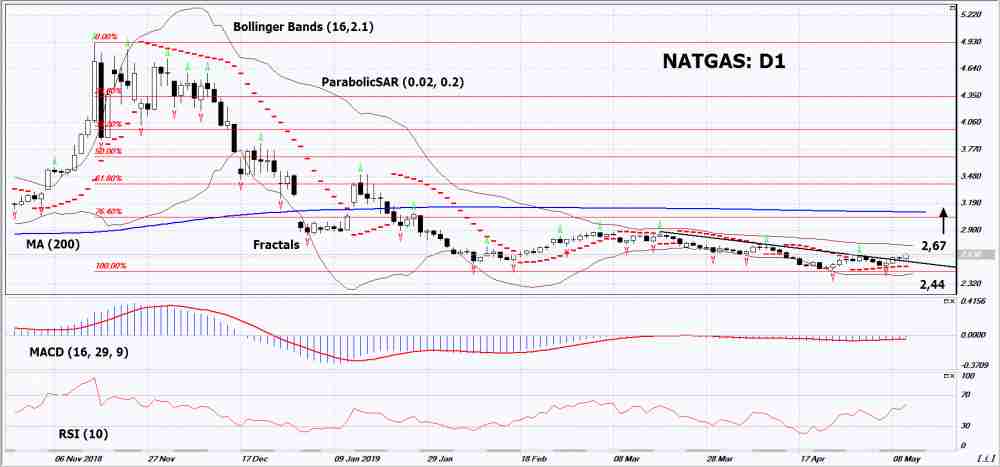
On a daily timeframe, Natgas: D1 пbroke up the downtrend resistance line and adjusted upward. Various technical analysis indicators have formed a signal of uptrend. Further growth of quotations is possible in case of an increase in demand in the USA.
- The Parabolic Indicatorshows a signal to increase.
- The Bollinger bands expanded, indicating high volatility. Both lines of Bollinger have a slope up.
- The RSI Indicator is above the 50 mark. There are no divergences.
- The MACD Indicatorshows a signal to increase.
The bullish momentum may develop if Natgas exceed its last maximum: 2.67. This level may serve as an entry point. The initial stop loss may be placed below the last two lower fractals, the bottom Bollinger line, the minimum since June 2016 and the Parabolic signal: 2.44. After opening the pending order, we shall move the stop to the next fractal low following the Bollinger and Parabolic signals to the next fractal minimum. Thus, we are changing the potential profit/loss to the breakeven point. More risk-averse traders may switch to the 4-hour chart after the trade and place there a stop loss moving it in the direction of the trade. If the price meets the stop level (2,44) without reaching the order (2,67), we recommend to close the position: the market sustains internal changes that were not taken into account.
Summary of technical analysis
| Position | Buy |
| Buy stop | Above 2,67 |
| Stop loss | Below 2,44 |
- 取得證書

附注:
本文針對宣傳和教育, 是免費讀物. 文中所包含的資訊來自於公共管道. 不保障資訊的完整性和準確性. 部分文章不會更新. 所有的資訊, 包括觀點, 指數, 圖表等等僅用於介紹, 不能用於財務意見和建議. 所有的文字以及圖表不能作為交易的建議. IFC Markets及員工在任何情況下不會對讀者在閱讀文章中或之後採取的行為負責.
