- 分析
- 技術分析
香港股指 技術分析 - 香港股指 交易: 2019-08-22
HK50 technical setup turns bullish
Hong Kong inflation remained steady in July while unemployment ticked up. Will the HK50 advance continue?
Hong Kong economic data have been weak on balance recently: unemployment ticked up to 2.9% in July from 2.8%, the Q2 GDP contraction was revised downward to 0.4% decline from 0.3% of advance reading. However foreign exchange reserves rose while inflation remained steady at 3.3% when a decline to 2.8% was forecast. All these data were recorded against the background of contraction in the private sector activities as evidenced by decline in Markit’s PMI to 43.8 from 47.9 in June: readings above 50.0 indicate sector expansion, and contraction below. Deteriorated US-China trade relations are main reason for slowing of activities. However technical indicators point to upside momentum for Hong Kong stock market. And unresolved US-China trade dispute remains a downside risk for Hong Kong stock market.
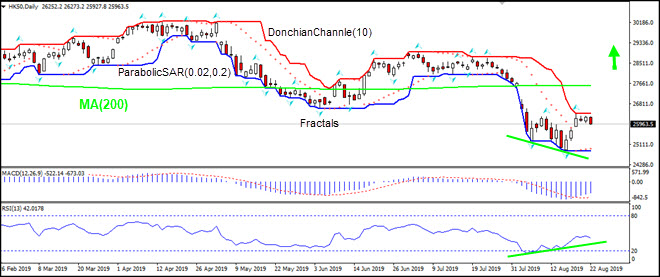
On the daily timeframe HK50: D1 is retracing higher after hitting 10-month low, still below the 200-day moving average MA(200), which is level.
- The Parabolic indicator has formed a buy signal.
- The Donchian channel indicates no trend yet: it is flat.
- The MACD indicator is below the signal line with the gap narrowing. This is a bullish signal.
- The RSI oscillator has not reached the overbought zone and has formed a bullish divergence.
We believe the bullish momentum will continue after the price breaches above the upper Donchian boundary at 26401.10. This level can be used as an entry point for placing a pending order to buy. The stop loss can be placed below the lower fractal at 24850.00. After placing the pending order the stop loss is to be moved every day to the next fractal low, following Parabolic signals. Thus, we are changing the expected profit/loss ratio to the breakeven point. If the price meets the stop-loss level (24850.00) without reaching the order (26401.10) we recommend cancelling the order: the market sustains internal changes which were not taken into account.
Technical Analysis Summary
| Order | Buy |
| Buy Stop | Above 26401.10 |
| Stop loss | Below 24850.00 |
- 取得證書

附注:
本文針對宣傳和教育, 是免費讀物. 文中所包含的資訊來自於公共管道. 不保障資訊的完整性和準確性. 部分文章不會更新. 所有的資訊, 包括觀點, 指數, 圖表等等僅用於介紹, 不能用於財務意見和建議. 所有的文字以及圖表不能作為交易的建議. IFC Markets及員工在任何情況下不會對讀者在閱讀文章中或之後採取的行為負責.
