- 分析
- 技術分析
香港股指 技術分析 - 香港股指 交易: 2019-03-08
Weak data bearish for HK50
Hong Kong’s economic growth slowed in Q4 2018 and private sector contraction continued in February. Will the HK50 continue declining?
Recent Hong-Kong economic data were weak: the economy shrank 0.3% over quarter in the last three months of 2018, the private sector contraction continued in February for eleventh straight month, however retail sales increased 6.9% over year in January after 0.1% growth in December and foreign exchange reserves increased from 432.1 billion Hong Kong dollars in January to 434.5 billion in February. At the same time latest Chinese data were negative: balance of trade surplus dropped to 4.12 billion dollars in February from 39.16 billion the previous month, with imports declining 5.2% year over year to 131.12 billion while exports fell 20.7% to 135.24 billion. China is Hong Kong’s biggest trading partner, and falling Chinese imports mean shrinking market for Hong Kong’s exports. Weak economic data are bearish for HK50.
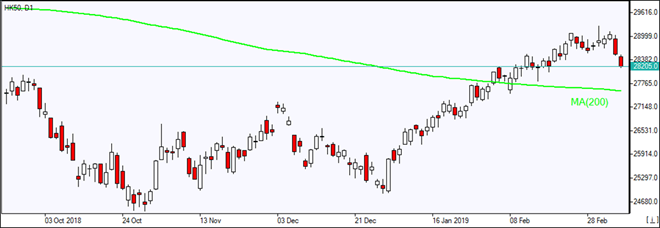
On the daily timeframe the HK50: D1 has breached below the support line, and is testing the Fibonacci 23.6 support level.
- The Parabolic indicator gives a sell signal.
- The Donchian channel indicates downtrend: it is widening down.
- The MACD indicator gives a bearish signal: it is above the signal line and the gap is narrowing.
- The Stochastic oscillator is falling but has not breached into oversold zone yet.
We believe the bearish momentum will continue after the price breaches below the lower boundary of Donchian channel and Fibonacci 23.6 level at 28220.0. This level can be used as an entry point for placing a pending order to sell. The stop loss can be placed above the last fractal high at 29269.5. After placing the order, the stop loss is to be moved every day to the next fractal high, following Parabolic signals. Thus, we are changing the expected profit/loss ratio to the breakeven point. If the price meets the stop loss level (29269.5) without reaching the order (28220.0), we recommend cancelling the order: the market has undergone internal changes which were not taken into account.
Technical Analysis Summary
| Position | Sell |
| Sell stop | Below 28220.0 |
| Stop loss | Above 29269.5 |
- 取得證書

附注:
本文針對宣傳和教育, 是免費讀物. 文中所包含的資訊來自於公共管道. 不保障資訊的完整性和準確性. 部分文章不會更新. 所有的資訊, 包括觀點, 指數, 圖表等等僅用於介紹, 不能用於財務意見和建議. 所有的文字以及圖表不能作為交易的建議. IFC Markets及員工在任何情況下不會對讀者在閱讀文章中或之後採取的行為負責.
