- 分析
- 技術分析
英國股指 技術分析 - 英國股指 交易: 2019-08-23
Weak UK data bearish for GB100
Retail sales growth slowed in July after GDP contraction in second quarter. Will the GB 100 continue declining?
Recent UK economic data were negative on balance after the second quarter GDP contracted 0.2% over quarter follwoing 0.5% growth in Q1. And retail sales growth slowed in July though a decline was expected, with retail price index growth slowing to 2.8% over year in July from 2.9%. Weaker economic data are bearish for GB100.
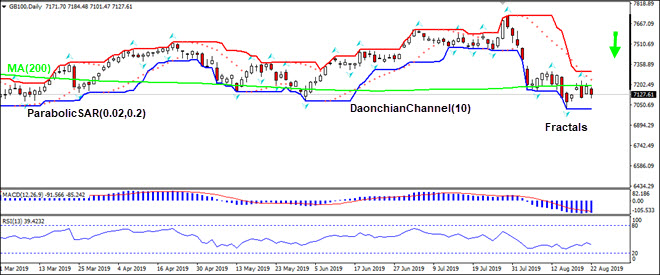
On the daily timeframe the GB100: D1 is below the 200-day moving average MA(200) which has levelled off.
- The Parabolic indicator gives a sell signal.
- The Donchian channel indicates no trend yet: it is flat.
- The MACD indicator gives a neutral signal: it is below the signal line and the gap is steady.
- The RSI oscillator is declining but has not reached the oversold zone yet.
We believe the bearish momentum will continue after the price breaches below the lower boundary of Donchian channel at 7017.13. This level can be used as an entry point for placing a pending order to sell. The stop loss can be placed above the upper Donchian channel at 7303.07. After placing the order, the stop loss is to be moved every day to the next fractal high, following Parabolic signals. Thus, we are changing the probable profit/loss ratio to the breakeven point. If the price meets the stop loss level (7303.07) without reaching the order (7017.73), we recommend cancelling the order: the market has undergone internal changes which were not taken into account.
Technical Analysis Summary
| Order | Sell |
| Sell stop | Below 7017.73 |
| Stop loss | Above 7303.07 |
- 取得證書

附注:
本文針對宣傳和教育, 是免費讀物. 文中所包含的資訊來自於公共管道. 不保障資訊的完整性和準確性. 部分文章不會更新. 所有的資訊, 包括觀點, 指數, 圖表等等僅用於介紹, 不能用於財務意見和建議. 所有的文字以及圖表不能作為交易的建議. IFC Markets及員工在任何情況下不會對讀者在閱讀文章中或之後採取的行為負責.
