- 分析
- 技術分析
英國股指 技術分析 - 英國股指 交易: 2019-06-10
World central banks are going to support economic growth
The plans of the US Federal Reserve and the European Central Bank to continue monetary stimulation of their national economies lowered the risk of a global recession, which caused a significant increase in stock markets. Will the GB100 quotations continue growing?
The ECB is going to continue issuing the euro under the TLTRO program for a total of 2.6 trillion euros. In addition, it can lower the rate by 0.1% until the end of this year. According to the interest futures quotes, the probability of such an event is 70%. According to the ECB, these measures will accelerate economic growth in the Eurozone from 1.2% in 2019 to 1.4% in 2020/21. In the USA, weak labor market data (non-farm payrolls) for May was published. According to the quotation of interest futures on the Chicago stock exchange, the probability of a reduction in the Fed rate at a meeting on July 31, 2019 reached 85%. The FTSE 100 index is growing in line with the global trend. Additional positive impact on it may be the plans to conclude a separate trade agreement between the UK and the United States. Since the beginning of this year, the FTSE 100 has grown by 9%. This is less than the increase in such indices as DAX, CAC40, S & P500 and others.
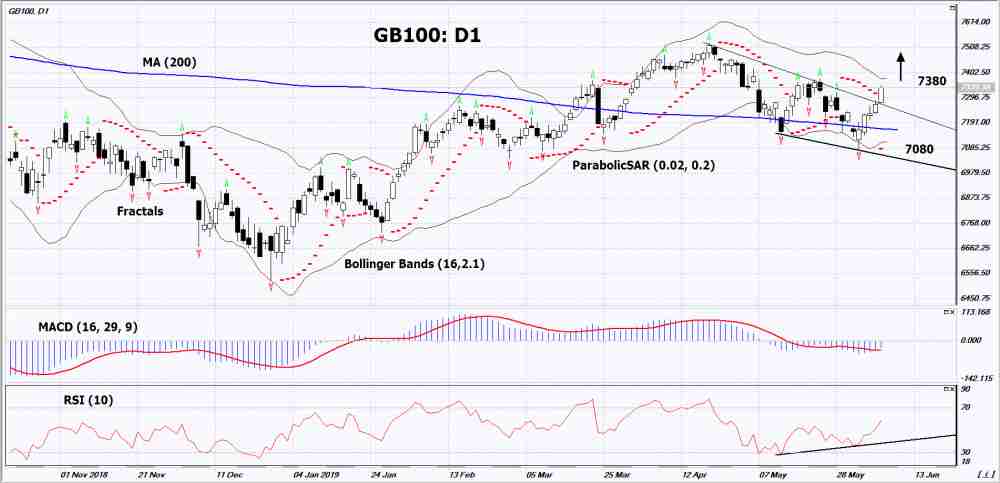
On the daily timeframe GB100: D1 broke up the resistance line of the downward channel. Various technical analysis indicators have generated uptrend signals. Further growth of quotations is possible in the event of a successful completion of Brexit and positive trade negotiations between the US and the UK.
- The Parabolic indicator shows an uptrend signal.
- The Bolinger Bands narrowed, indicating a volatility decrease. Both lines of Bollinger have a slope up
- The RSI indicator is above the 50 mark. It has formed a divergence to the increase.
- The MACD indicatorgives a buy signal.
The bullish momentum may develop in case if GB100 exceeds its last two fractals and the upper Bollinger line: 7380. This level may serve as an entry point. The initial stop loss may be placed below the last lower fractal, the bottom Bollinger line, the 200-day moving average line and the Parabolic signal: 7080. After opening the pending order, we shall move the stop to the next fractal low following the Bollinger and Parabolic signals. Thus, we are changing the potential profit/loss to the breakeven point. More risk-averse traders may switch to the 4-hour chart after the trade and place a stop loss moving it in the direction of the trade. If the price meets the stop level (7080) without reaching the order (7380), we recommend to cancel the order: the market sustains internal changes that were not taken into account.
Technical Analysis Summary
| Position | Buy |
| Buy stop | Above 7380 |
| Stop loss | Below 7080 |
- 取得證書

附注:
本文針對宣傳和教育, 是免費讀物. 文中所包含的資訊來自於公共管道. 不保障資訊的完整性和準確性. 部分文章不會更新. 所有的資訊, 包括觀點, 指數, 圖表等等僅用於介紹, 不能用於財務意見和建議. 所有的文字以及圖表不能作為交易的建議. IFC Markets及員工在任何情況下不會對讀者在閱讀文章中或之後採取的行為負責.
