- 分析
- 技術分析
法國股指 技術分析 - 法國股指 交易: 2018-12-28
Weaker French data bearish for FR40
Third quarter French economic growth was revised lower. Will the FR 40 continue declining?
Recent French economic data were negative: French Q3 GDP growth was revised lower. French economy expanded 1.4% year-over-year in the third quarter, down from an upwardly revised 1.7% growth in the previous three-month period. The economic growth rate over previous quarter was revised lower to 0.3% in the three months to September 2018, compared to a near one-year high of 0.4% initial estimate. And while household consumption grew by 0.4% and fixed investment by businesses also grew faster there are significant downside external and internal risks for fourth quarter GDP. Internally, the ‘yellow vest’ protests in response to a proposed fuel-tax hike will have a negative effect on output, and externally protracted US-China trade dispute and uncertainty surrounding its outcome is hurting global growth prospects. Weak economic data are bearish for French stock index FR 40.
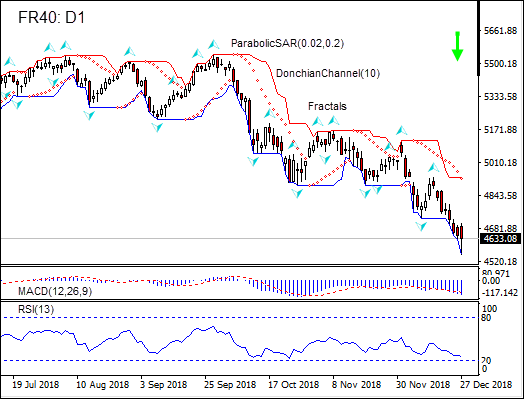
On the daily timeframe the FR40: D1 is declining after retracing to 6-month high in the end of September.
- The Parabolic indicator gives a sell signal.
- The Donchian channel indicates downtrend: it is tilted lower.
- The MACD indicator gives a bearish signal: it is below the signal line and the gap is widening.
- The Stochastic oscillator has breached into the oversold zone, this is bullish.
We believe the bearish momentum will continue after the price closes below the lower boundary of Donchian channel at 4553.58. This level can be used as an entry point for placing a pending order to sell. The stop loss can be placed above the last fractal high at 4935.02. After placing the order, the stop loss is to be moved every day to the next fractal high, following Parabolic signals. Thus, we are changing the expected profit/loss ratio to the breakeven point. If the price meets the stop loss level (4935.02) without reaching the order (4553.58), we recommend cancelling the order: the market has undergone internal changes which were not taken into account.
Technical Analysis Summary
| Position | Sell |
| Sell stop | Below 4553.58 |
| Stop loss | Above 4935.02 |
- 取得證書

附注:
本文針對宣傳和教育, 是免費讀物. 文中所包含的資訊來自於公共管道. 不保障資訊的完整性和準確性. 部分文章不會更新. 所有的資訊, 包括觀點, 指數, 圖表等等僅用於介紹, 不能用於財務意見和建議. 所有的文字以及圖表不能作為交易的建議. IFC Markets及員工在任何情況下不會對讀者在閱讀文章中或之後採取的行為負責.
