- 分析
- 技術分析
EUR/USD 技術分析 - EUR/USD 交易: 2019-02-08
Slowing euro-zone business activity bearish for EURUSD
Euro-zone’s private sector expansion slowed in December. Will the EURUSD continue declining?
After the European Central Bank January 24 decision to leave policy unchanged euro-zone’s economic data have been negative on balance. The economy slowed in the fourth quarter of 2018 compared with the same period a year ago: Q4 GDP increased 1.2% over year after 1.6% growth in Q3. Retail sales growth was slower in December: it rose 0.8% over year after 1.8% increases in November. And private sector expansion slowed in January as evidenced by the Markit Composite PMI. Slowing of expansion in euro-zone economy is bearish for euro.
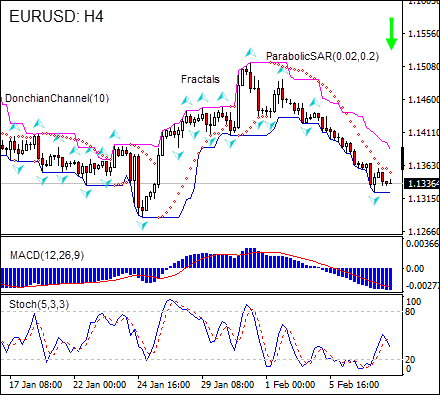
On the 4-hour timeframe EURUSD:H4 is retracing after it hit 4-week high in mid-January.
- The Donchian channel indicates downtrend: it is narrowing down.
- The MACD indicator is below the signal line and the gap is widening, which is a bearish signal.
- The Parabolic indicator gives a sell signal.
- The stochastic oscillator is falling but has not reached the oversold zone.
We believe the bearish momentum will continue after the price breaches the below the lower Donchian boundary at 1.1324. A price point below that level can be used as an entry point for a pending order to sell. The stop loss can be placed above the fractal high at 1.1440. After placing the pending order the stop loss is to be moved every day to the next fractal high, following Parabolic signals. Thus, we are changing the expected profit/loss ratio to the breakeven point. If the price meets the stop-loss level (1.1440) without reaching the order we recommend cancelling the order: the market sustains internal changes which were not taken into account.
Technical Analysis Summary
| Position | Sell |
| Sell stop | Below 1.1324 |
| Stop loss | Above 1.1440 |
- 取得證書

附注:
本文針對宣傳和教育, 是免費讀物. 文中所包含的資訊來自於公共管道. 不保障資訊的完整性和準確性. 部分文章不會更新. 所有的資訊, 包括觀點, 指數, 圖表等等僅用於介紹, 不能用於財務意見和建議. 所有的文字以及圖表不能作為交易的建議. IFC Markets及員工在任何情況下不會對讀者在閱讀文章中或之後採取的行為負責.
