- 分析
- 技術分析
棉花 技術分析 - 棉花 交易: 2019-07-02
Leaders of the United States and China have agreed to resume trade negotiations
At the G20 meeting last weekend, Chinese Chairman Xi Jinping and US president Donald Trump agreed to resume trade negotiations between the countries. Will the Cotton quotations increase?
The American president expressed the hope that China will acquire more agricultural products from the United States. China acquires about a quarter of global cotton imports and is the largest importer. The United States ranks 1st in the world in the export of cotton with a share of about 38%. After the announcement of the successful conclusion of negotiations between the leaders of the United States and China, the cotton quotations soared by 3% and updated a maximum of a month. An additional positive factor could be a reduction in the forecast for cotton crop area in the US in the agricultural season 2019/20 from U.S. Department of Agriculture (USDA). In the June forecast of the US Department of Agriculture, an area of 13.72 million acres is indicated, which is less than its March estimate of 13.78 million acres. The India Meteorological Department reported that June this year turned out to be the driest in the last 5 years and the amount of precipitation decreased by about a third compared with the average level. Drought can reduce cotton production in India.
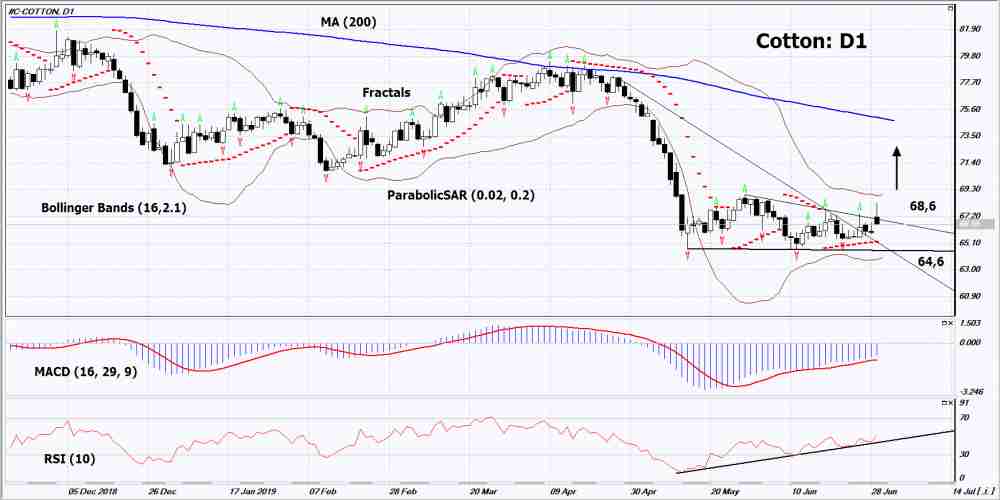
On the daily timeframe Cotton: D1 is trying to exit the downtrend and from the triangle to the top. Various technical analysis indicators have generated an uptrend signals. Further growth of quotations is possible in case of an increase in global demand and deterioration of the weather in India.
- The Parabolic indicator shows a signal to increase.
- The Bolinger bandsnarrowed, indicating a volatility decrease. Both lines of Bollinger have a slope up.
- The RSI indicator is above the 50 mark. It has formed a divergence to the increase.
- The MACD indicator shows a signal to increase.
The billish momentum may develop if the Cotton exceeds its last maximum: 68.6. This level can be used as an entry point. The initial stop lose may be placed below the last three lower fractals, the Parabolic signal and a 3-year low: 64.6. After placing the pending order, the stop loss shall be moved following the signals of Bollinger and Parabolic to the next fractal minimum.Thus, we are changing the potential profit/loss to the breakeven point. More risk-averse traders may switch to the 4-hour chart after the trade and place a stop loss moving it in the direction of the trade. If the price meets the stop level (64,6)) without reaching the order (68,6), we recommend to cancel the order: the market sustains internal changes that were not taken into account.
Technical Analysis Summary
| Position | Buy |
| Buy stop | Above 68,6 |
| Stop loss | Below 64,6 |
- 取得證書

附注:
本文針對宣傳和教育, 是免費讀物. 文中所包含的資訊來自於公共管道. 不保障資訊的完整性和準確性. 部分文章不會更新. 所有的資訊, 包括觀點, 指數, 圖表等等僅用於介紹, 不能用於財務意見和建議. 所有的文字以及圖表不能作為交易的建議. IFC Markets及員工在任何情況下不會對讀者在閱讀文章中或之後採取的行為負責.
