- 分析
- 技術分析
銅 技術分析 - 銅 交易: 2018-11-20
The warming of US-China foreign trade relations may increase the demand for copper
Copper edges higher for the 5th trading session in a row ahead of the G20 summit. Will Copper prices continue rising?
Within the framework of the G20 meeting on December 1, 2018, the President of the People's Republic of China Xi Jinping and the President of the United States Donald Trump will meet. Market participants expect the softening of the mutual foreign trade sanctions of the two countries, which may increase the demand for copper in China. Copper reserves on the LME exchange approached the 10-year low. A noticeable decline in reserves is also noted on the Shanghai Stock Exchange. The agreement between the Chinese copper smelter Jiangxi Copper and the British mining company Antofagasta about reducing the cost of enrichment and processing of copper ore contributed to the increase in demand for copper. The Chilean Copper Commission (Cochilco) forecasts that global copper production, including copper scrap processing, will be 23.5 million tons in 2018, 24 million tons in 2019 and 24.5 million tons in 2020. At the same time, net copper production (excluding scrap processing) will be much less: 20.5 million tons in 2018, 21 million tons in 2019 and 21.3 million tons in 2020. However, global demand, according to Cochilco, will be 23.6 million, 24.1 million and 24.5 million tons during the same period of time. Thus, in 2018–2019, a world shortage of copper is possible, which should be covered by reserves.
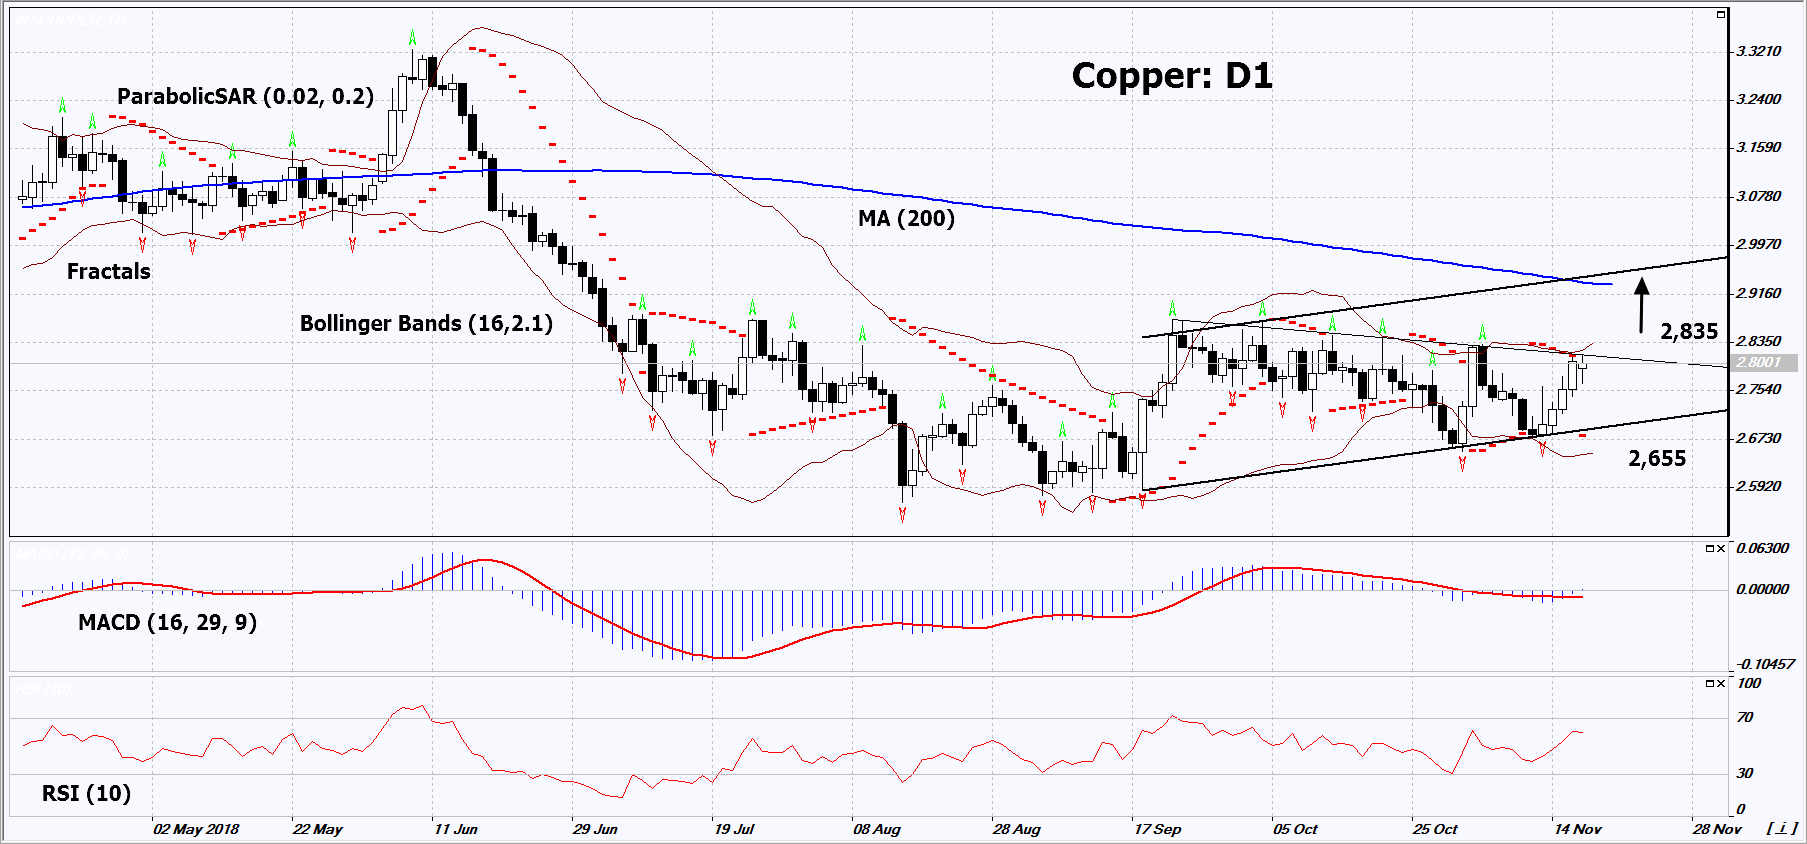
On the daily timeframe, Copper: D1 is correcting upward within the medium-term rising channel and approached the resistance line of the short-term downtrend. A number of technical analysis indicators formed buy signals. The further price growth is possible in case of an increase in global demand.
- The Parabolic indicator gives a bullish signal.
- The Bollinger bands have widened, which indicates high volatility. Both bands are titled upwards.
- The RSI indicator is above 50. No divergence.
- The MACD indicator gives a bullish signal.
The bullish momentum may develop in case Copper exceeds the last fractal high, the resistance line of the short-term downtrend and the upper Bollinger band at 2.835. This level may serve as an entry point. The initial stop loss may be placed below the two last fractal lows, the Parabolic signal and the lower Bollinger band at 2.655. After opening the pending order, we shall move the stop to the next fractal low following the Bollinger and Parabolic signals. Thus, we are changing the potential profit/loss to the breakeven point. More risk-averse traders may switch to the 4-hour chart after the trade and place there a stop loss moving it in the direction of the trade. If the price meets the stop level (2.655) without reaching the order (2.835), we recommend cancelling the position: the market sustains internal changes that were not taken into account.
Summary of technical analysis
| Position | Buy |
| Buy stop | Above 2.835 |
| Stop loss | Below 2.655 |
- 取得證書

附注:
本文針對宣傳和教育, 是免費讀物. 文中所包含的資訊來自於公共管道. 不保障資訊的完整性和準確性. 部分文章不會更新. 所有的資訊, 包括觀點, 指數, 圖表等等僅用於介紹, 不能用於財務意見和建議. 所有的文字以及圖表不能作為交易的建議. IFC Markets及員工在任何情況下不會對讀者在閱讀文章中或之後採取的行為負責.
