- 分析
- 技術分析
可可 技術分析 - 可可 交易: 2017-01-11
Political crisis in Cote-d’Ivoire
Cocoa prices are correcting up amid the armed revolt in Cote-d’Ivoire and slightly worsened weather in West Africa. Will cocoa prices continue rising?
Around 35% of global cocoa crops are harvested in Cote-d’Ivoire while Western Africa in general accounts for 75%. End of previous week ex-soldiers seized control of Bouaké which is the 2nd largest city in Cote-d’Ivoire. The country’s prime-minister resigned along with his government on Monday while the security chiefs were dismissed. Higher political risks in the country pushed global cocoa prices up. Soldiers demand higher wages and social benefits. The government can barely do that as cocoa prices hit an almost 4-year low last week so the budget income is not high enough. Moreover, cocoa shipments from Cote-d’Ivoire fell since October 1 to January 8, 2017 to 929 thousand tonnes from 967 thousand tonnes in the same period of previous season. Given low prices, Coffee and Cocoa Council in Cote-d’Ivoire suspended forward sales of cocoa in agricultural season 2017/18. This raised market uncertainty. There is being quite a wide range of assessments of global surplus in cocoa market – from 150 to 225 thousand tonnes. This may raise the volatility of cocoa prices amid changing weather conditions in North Africa.
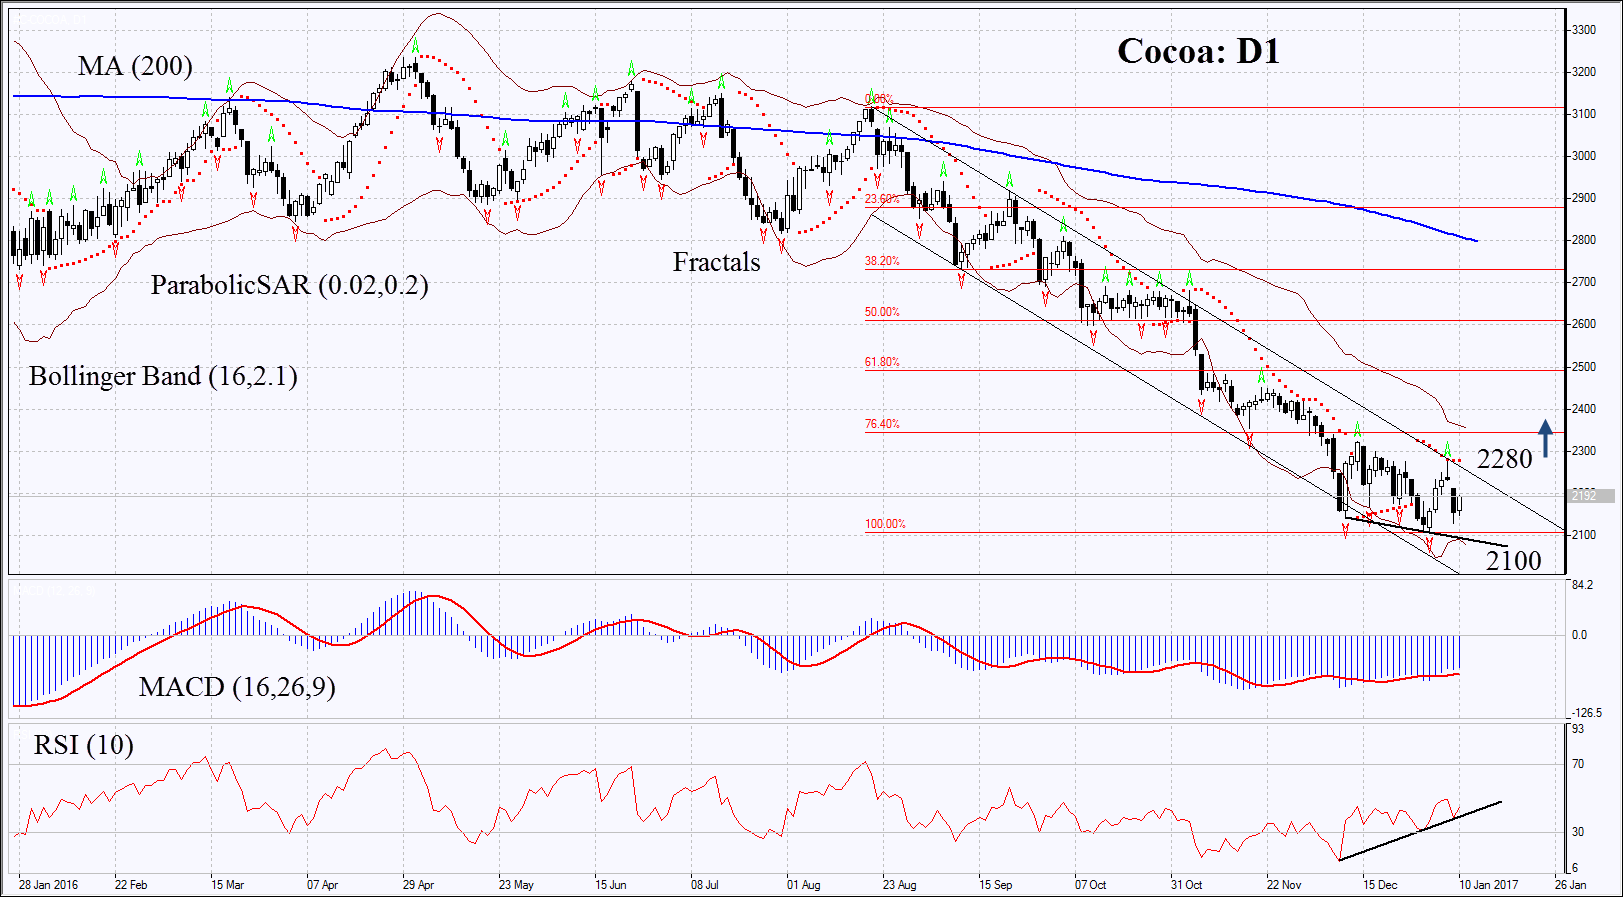
On the daily chart Cocoa: D1 is in descending channel. Its decline slowed down recently and several indicators have formed signals to buy. Further price increase is possible in case of heightening political tensions in Cote-d’Ivoire and worsened weather conditions in West Africa.
- The Parabolic indicator gives bearish signal. It may serve the additional level of resistance which has to be surpassed to open long position.
- The Bollinger bands have widened which means lower volatility.
- RSI is below 50, it has formed positive divergence.
- MACD gives bullish signal.
The bullish momentum may develop in case cocoa surpasses the last fractal high, resistance of the descending channel and the Parabolic signal at 2280. This level may serve the point of entry. The initial stop-loss may be placed below the last fractal low and the 4-year low at 2100. Having opened the pending order we shall move the stop to the next fractal low following the Parabolic and Bollinger signals. Thus, we are changing the probable profit/loss ratio to the breakeven point. The most risk-averse traders may switch to the 4-hour chart after the trade and place there a stop-loss moving it in the direction of the trade. If the price meets the stop-loss level at 2100 without reaching the order at 2280, we recommend cancelling the position: the market sustains internal changes which were not taken into account.
Summary of technical analysis
| Position | Buy |
| Buy stop | above 2280 |
| Stop loss | below 2100 |
- 取得證書

附注:
本文針對宣傳和教育, 是免費讀物. 文中所包含的資訊來自於公共管道. 不保障資訊的完整性和準確性. 部分文章不會更新. 所有的資訊, 包括觀點, 指數, 圖表等等僅用於介紹, 不能用於財務意見和建議. 所有的文字以及圖表不能作為交易的建議. IFC Markets及員工在任何情況下不會對讀者在閱讀文章中或之後採取的行為負責.
