- 分析
- 技術分析
人民幣對盧布 技術分析 - 人民幣對盧布 交易: 2019-05-08
Preparing for US-China trade negotiations and publication of statistics
In this review, we suggest considering the personal composite instrument (PCI) CNHRUB. It reflects the price dynamics of the Chinese yuan against the Russian ruble. Will the CNHRUB rise?
Such a movement on the chart is observed in case of the weakening of the ruble and strengthening of the yuan against the US dollar. A significant positive factor for the Chinese currency may be Vice-Premier Liu He’s visit to the United States for trade negotiations on May 9. Earlier, these negotiations were in question because of US President Donald Trump’s statement about plans to increase duties on Chinese goods. Amid this, on Monday, the yuan fell to the 3.5-month low against the US dollar, but now it has started to recover gradually. Important macroeconomic data on inflation and China’s trade balance for April may affect its exchange rate. They will be released on May 8-9. In turn, the decline in world oil prices, as well as plans of the Central Bank of the Russian Federation to ease the monetary policy have a negative impact on the Russian ruble exchange rate. Inflation in Russia is 5.2% year over year, and the rate of the Central Bank is at a noticeably higher level of 7.75%.
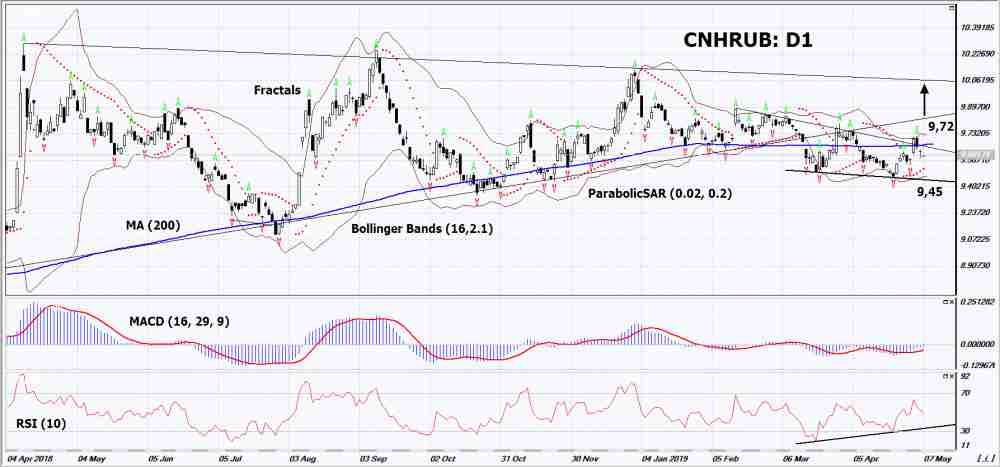
On the daily timeframe, CNHRUB: D1 is in a downtrend, but it has approached its resistance line. Before opening a buy position, the CNHRUB should breached it up. A number of technical analysis indicators formed buy signals. The further price increase is possible in case of positive macroeconomic and political data from China and statements about a rate cut by the Central Bank of the Russian Federation.
- The Parabolic Indicator gives a bullish signal.
- The Bollinger bands have narrowed, which indicates high volatility. The lower Bollinger band is titled upward.
- The RSI indicator is below 50. It has formed a positive divergence.
- The MACD indicator gives a bullish signal.
The bullish momentum may develop in case CNHRUB exceeds the upper Bollinger band, the last fractal high, the 200-moving average line and the resistance line of the downtrend at 9.72. This level may serve as an entry point. The initial stop loss may be placed below the two last fractal lows, the Parabolic signal, the low since November 2017 and the lower Bollinger band at 9.45. After opening the pending order, we shall move the stop to the next fractal low following the Bollinger and Parabolic signals. Thus, we are changing the potential profit/loss to the breakeven point. More risk-averse traders may switch to the 4-hour chart after the trade and place there a stop loss moving it in the direction of the trade. If the price meets the stop level (9.45) without reaching the order (9.72), we recommend to close the position: the market sustains internal changes that were not taken into account.
Summary of technical analysis
| Position | Buy |
| Buy stop | Above 9.72 |
| Stop loss | Below 9.45 |
- 取得證書

附注:
本文針對宣傳和教育, 是免費讀物. 文中所包含的資訊來自於公共管道. 不保障資訊的完整性和準確性. 部分文章不會更新. 所有的資訊, 包括觀點, 指數, 圖表等等僅用於介紹, 不能用於財務意見和建議. 所有的文字以及圖表不能作為交易的建議. IFC Markets及員工在任何情況下不會對讀者在閱讀文章中或之後採取的行為負責.
